> ## Documentation Index
> Fetch the complete documentation index at: https://docs.theoptimizer.io/llms.txt
> Use this file to discover all available pages before exploring further.

# Create Custom Metrics

> Define your own metric formulas using any combination of available metrics — then use them as columns in the table and as conditions in automation rules.

export const ArcadeVideoButton = ({id, title = "Watch interactive demo", label = "Watch Video"}) => {
  const [open, setOpen] = useState(false);
  return <div style={{
    display: 'inline-block'
  }}>
      <button type="button" onClick={() => setOpen(true)} style={{
    display: 'inline-flex',
    alignItems: 'center',
    gap: '8px',
    backgroundColor: '#3e47ec',
    color: '#ffffff',
    border: 'none',
    padding: '10px 18px',
    borderRadius: '8px',
    fontSize: '15px',
    fontWeight: '600',
    cursor: 'pointer'
  }}>
        <svg xmlns="http://www.w3.org/2000/svg" width="16" height="16" viewBox="0 0 24 24" fill="white">
          <polygon points="5,3 19,12 5,21" />
        </svg>
        {label}
      </button>

      {open && <div onClick={() => setOpen(false)} style={{
    position: 'fixed',
    top: 0,
    left: 0,
    width: '100%',
    height: '100%',
    backgroundColor: 'rgba(0, 0, 0, 0.85)',
    zIndex: 9999999,
    display: 'flex',
    alignItems: 'center',
    justifyContent: 'center'
  }}>
          <div onClick={e => e.stopPropagation()} style={{
    width: '90%',
    maxWidth: '1100px',
    aspectRatio: '16 / 9',
    borderRadius: '12px',
    overflow: 'hidden',
    position: 'relative'
  }}>
            <iframe src={`https://demo.arcade.software/${id}?embed&embed_mobile=tab&embed_desktop=inline&show_copy_link=true`} title={title} frameBorder="0" loading="lazy" allowFullScreen allow="clipboard-write" style={{
    width: '100%',
    height: '100%',
    border: 'none',
    colorScheme: 'light'
  }} />
          </div>

          <button type="button" onClick={() => setOpen(false)} style={{
    position: 'fixed',
    top: '20px',
    right: '24px',
    background: 'rgba(255,255,255,0.15)',
    border: 'none',
    color: '#ffffff',
    fontSize: '24px',
    lineHeight: 1,
    width: '40px',
    height: '40px',
    borderRadius: '50%',
    cursor: 'pointer',
    display: 'flex',
    alignItems: 'center',
    justifyContent: 'center'
  }}>
            ✕
          </button>
        </div>}
    </div>;
};

export const ArcadePopoutModal = ({id, title = "Interactive demo"}) => {
  const [isPopout, setIsPopout] = useState(false);
  const iframeRef = useRef(null);
  useEffect(() => {
    function onArcadeIframeMessage(e) {
      if (e.origin !== 'https://demo.arcade.software' || !e.isTrusted) return;
      if (!iframeRef.current || !iframeRef.current.contentWindow) return;
      if (e.data.event === 'arcade-init') {
        iframeRef.current.contentWindow.postMessage({
          event: 'register-popout-handler'
        }, '*');
      }
      if (e.data.event === 'arcade-popout-open') {
        setIsPopout(true);
      }
      if (e.data.event === 'arcade-popout-close') {
        setIsPopout(false);
      }
    }
    window.addEventListener('message', onArcadeIframeMessage);
    return () => window.removeEventListener('message', onArcadeIframeMessage);
  }, []);
  return <div style={{
    position: 'relative',
    paddingBottom: 'calc(54.4737% + 41px)',
    height: 0,
    width: '100%'
  }}>
      <iframe ref={iframeRef} src={`https://demo.arcade.software/${id}?embed&embed_mobile=tab&embed_desktop=modal&show_copy_link=true`} title={title} frameBorder="0" loading="lazy" allowFullScreen allow="clipboard-write" style={{
    position: isPopout ? 'fixed' : 'absolute',
    top: 0,
    left: 0,
    width: '100%',
    height: '100%',
    zIndex: isPopout ? 9999999 : 'auto',
    colorScheme: 'light'
  }} />
    </div>;
};

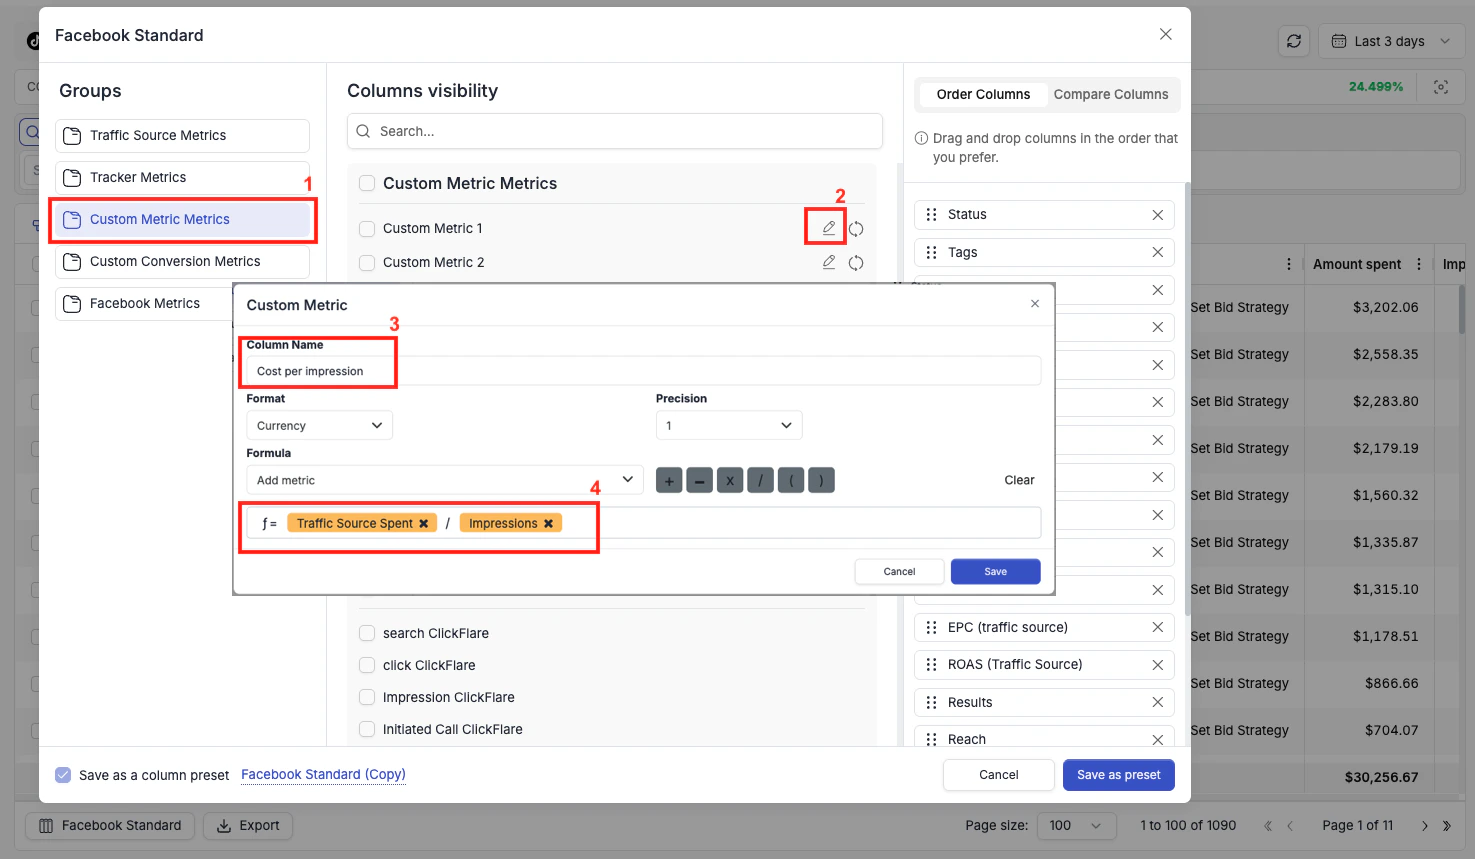
If the default metrics don't cover something you track, you can define up to **10 custom metrics** using your own formulas. Once created, they appear as columns in any column preset and are also available as conditions inside your automation rules.

<Frame>
  <img src="https://mintcdn.com/theoptimizer/d8i_PgwXHcJW-VUm/images/campaigns-custom-metrics1.png?fit=max&auto=format&n=d8i_PgwXHcJW-VUm&q=85&s=c292a8bca370edffcfc07ac9205c8603" alt="Campaigns Custom Metrics1" width="1475" height="859" data-path="images/campaigns-custom-metrics1.png" />
</Frame>

***

## Creating a Custom Metric

<Steps>
  <Step title="Open Column Management">
    Click the column settings icon at the bottom-left of the table.
  </Step>

  <Step title="Select Custom Metric">
    Click **Custom Metric** in the left panel. You will see a list of 10 custom metric slots.
  </Step>

  <Step title="Edit a slot">
    Click the edit icon next to any empty slot.
  </Step>

  <Step title="Configure the metric">
    Enter a **Column Name**, select the **Format** (Currency or Percentage), and set the **Precision** (number of decimal places to display).
  </Step>

  <Step title="Build the formula">
    Use the formula builder to select metrics from the dropdown and combine them using `+`, `−`, `×`, `/`, `(`, `)` operators.
  </Step>

  <Step title="Save">
    Click **Save**. Your custom metric is immediately available as a column in any preset and as a condition in your automation rules.
  </Step>
</Steps>

<Note>
  Custom metrics are available across all ad networks — not just the one you created them on. Make sure your formula references metrics that exist for each network you plan to use the column with.
</Note>
