> ## Documentation Index
> Fetch the complete documentation index at: https://docs.theoptimizer.io/llms.txt
> Use this file to discover all available pages before exploring further.

# Customize & Save Columns

> Choose which metrics appear in the campaign table, reorder them, and save column presets for different workflows — including shared presets visible to your whole team.

export const ArcadeVideoButton = ({id, title = "Watch interactive demo", label = "Watch Video"}) => {
  const [open, setOpen] = useState(false);
  return <div style={{
    display: 'inline-block'
  }}>
      <button type="button" onClick={() => setOpen(true)} style={{
    display: 'inline-flex',
    alignItems: 'center',
    gap: '8px',
    backgroundColor: '#3e47ec',
    color: '#ffffff',
    border: 'none',
    padding: '10px 18px',
    borderRadius: '8px',
    fontSize: '15px',
    fontWeight: '600',
    cursor: 'pointer'
  }}>
        <svg xmlns="http://www.w3.org/2000/svg" width="16" height="16" viewBox="0 0 24 24" fill="white">
          <polygon points="5,3 19,12 5,21" />
        </svg>
        {label}
      </button>

      {open && <div onClick={() => setOpen(false)} style={{
    position: 'fixed',
    top: 0,
    left: 0,
    width: '100%',
    height: '100%',
    backgroundColor: 'rgba(0, 0, 0, 0.85)',
    zIndex: 9999999,
    display: 'flex',
    alignItems: 'center',
    justifyContent: 'center'
  }}>
          <div onClick={e => e.stopPropagation()} style={{
    width: '90%',
    maxWidth: '1100px',
    aspectRatio: '16 / 9',
    borderRadius: '12px',
    overflow: 'hidden',
    position: 'relative'
  }}>
            <iframe src={`https://demo.arcade.software/${id}?embed&embed_mobile=tab&embed_desktop=inline&show_copy_link=true`} title={title} frameBorder="0" loading="lazy" allowFullScreen allow="clipboard-write" style={{
    width: '100%',
    height: '100%',
    border: 'none',
    colorScheme: 'light'
  }} />
          </div>

          <button type="button" onClick={() => setOpen(false)} style={{
    position: 'fixed',
    top: '20px',
    right: '24px',
    background: 'rgba(255,255,255,0.15)',
    border: 'none',
    color: '#ffffff',
    fontSize: '24px',
    lineHeight: 1,
    width: '40px',
    height: '40px',
    borderRadius: '50%',
    cursor: 'pointer',
    display: 'flex',
    alignItems: 'center',
    justifyContent: 'center'
  }}>
            ✕
          </button>
        </div>}
    </div>;
};

export const ArcadePopoutModal = ({id, title = "Interactive demo"}) => {
  const [isPopout, setIsPopout] = useState(false);
  const iframeRef = useRef(null);
  useEffect(() => {
    function onArcadeIframeMessage(e) {
      if (e.origin !== 'https://demo.arcade.software' || !e.isTrusted) return;
      if (!iframeRef.current || !iframeRef.current.contentWindow) return;
      if (e.data.event === 'arcade-init') {
        iframeRef.current.contentWindow.postMessage({
          event: 'register-popout-handler'
        }, '*');
      }
      if (e.data.event === 'arcade-popout-open') {
        setIsPopout(true);
      }
      if (e.data.event === 'arcade-popout-close') {
        setIsPopout(false);
      }
    }
    window.addEventListener('message', onArcadeIframeMessage);
    return () => window.removeEventListener('message', onArcadeIframeMessage);
  }, []);
  return <div style={{
    position: 'relative',
    paddingBottom: 'calc(54.4737% + 41px)',
    height: 0,
    width: '100%'
  }}>
      <iframe ref={iframeRef} src={`https://demo.arcade.software/${id}?embed&embed_mobile=tab&embed_desktop=modal&show_copy_link=true`} title={title} frameBorder="0" loading="lazy" allowFullScreen allow="clipboard-write" style={{
    position: isPopout ? 'fixed' : 'absolute',
    top: 0,
    left: 0,
    width: '100%',
    height: '100%',
    zIndex: isPopout ? 9999999 : 'auto',
    colorScheme: 'light'
  }} />
    </div>;
};

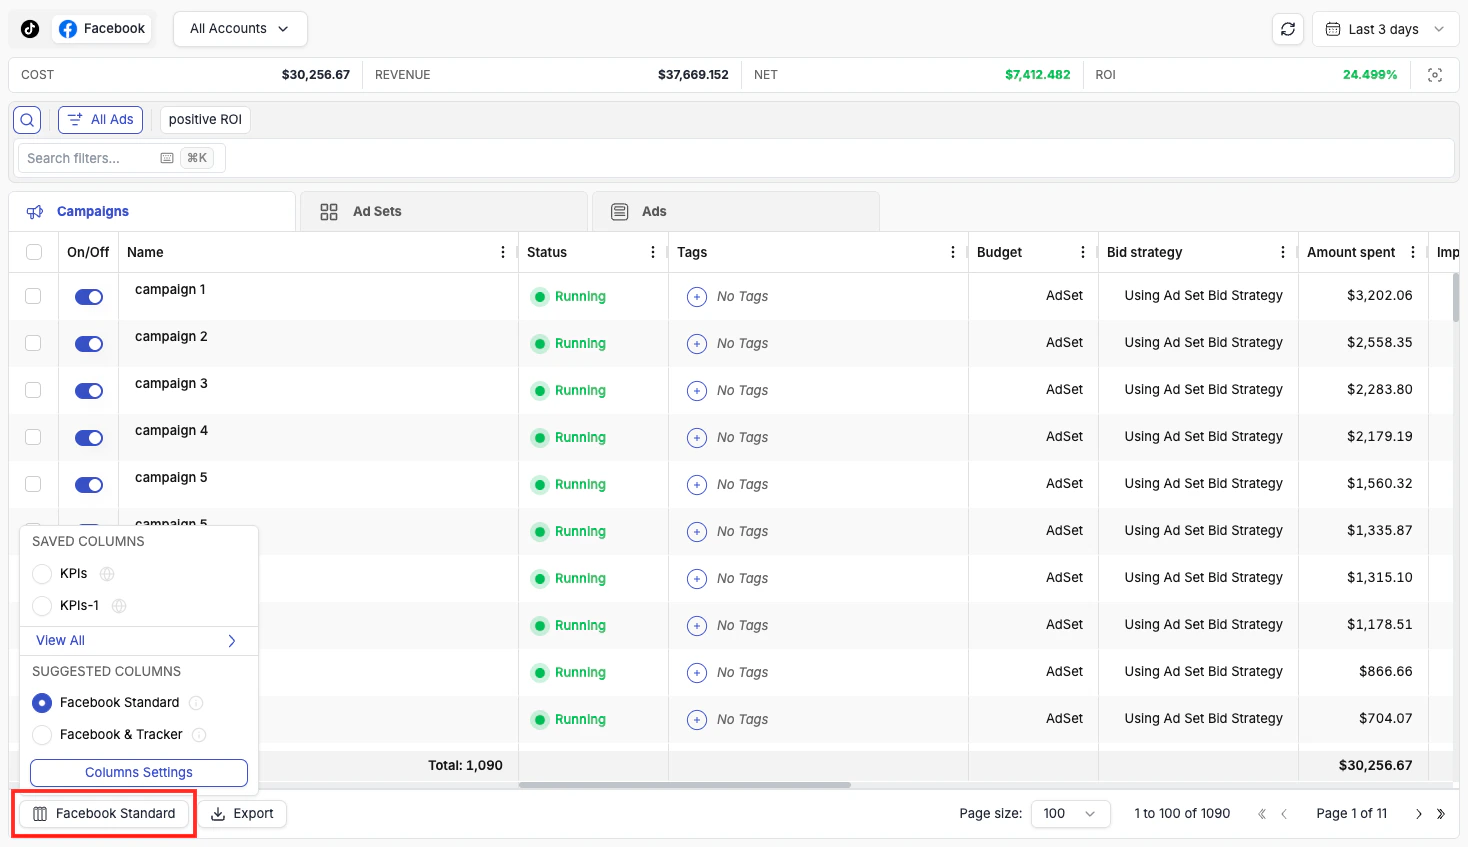
The column settings panel is at the bottom-left corner of the table. Click it to open the **Column Management** dialog.

***

## Default Column Views

TheOptimizer provides ready-made column presets for each ad network. For Facebook, for example, you get:

<Frame>
  <img src="https://mintcdn.com/theoptimizer/d8i_PgwXHcJW-VUm/images/campaigns-columns-defaults.png?fit=max&auto=format&n=d8i_PgwXHcJW-VUm&q=85&s=a3fdfdaa5e1dd9c763cb79fe782a38c3" alt="Campaigns Columns Defaults" width="1468" height="847" data-path="images/campaigns-columns-defaults.png" />
</Frame>

* **Facebook Standard** — essential Facebook ad network metrics only, with no tracker data. A clean, focused view for native Facebook performance.
* **Facebook + Tracker** — a combined view that merges the most important Facebook metrics with key tracker metrics side by side. This preset is only shown when you have a tracker connected.

Default presets cannot be deleted and are a good starting point for building your own views.

***

## Creating Custom Column Views

<Frame>
  <img src="https://mintcdn.com/theoptimizer/d8i_PgwXHcJW-VUm/images/campaigns-column-settings-view.png?fit=max&auto=format&n=d8i_PgwXHcJW-VUm&q=85&s=327033479fc8328e1cdad30db7765877" alt="Campaigns Column Settings View" width="2312" height="1600" data-path="images/campaigns-column-settings-view.png" />
</Frame>

<Steps>
  <Step title="Open Column Management">
    Click the column settings icon at the bottom-left of the table.
  </Step>

  <Step title="Browse column groups">
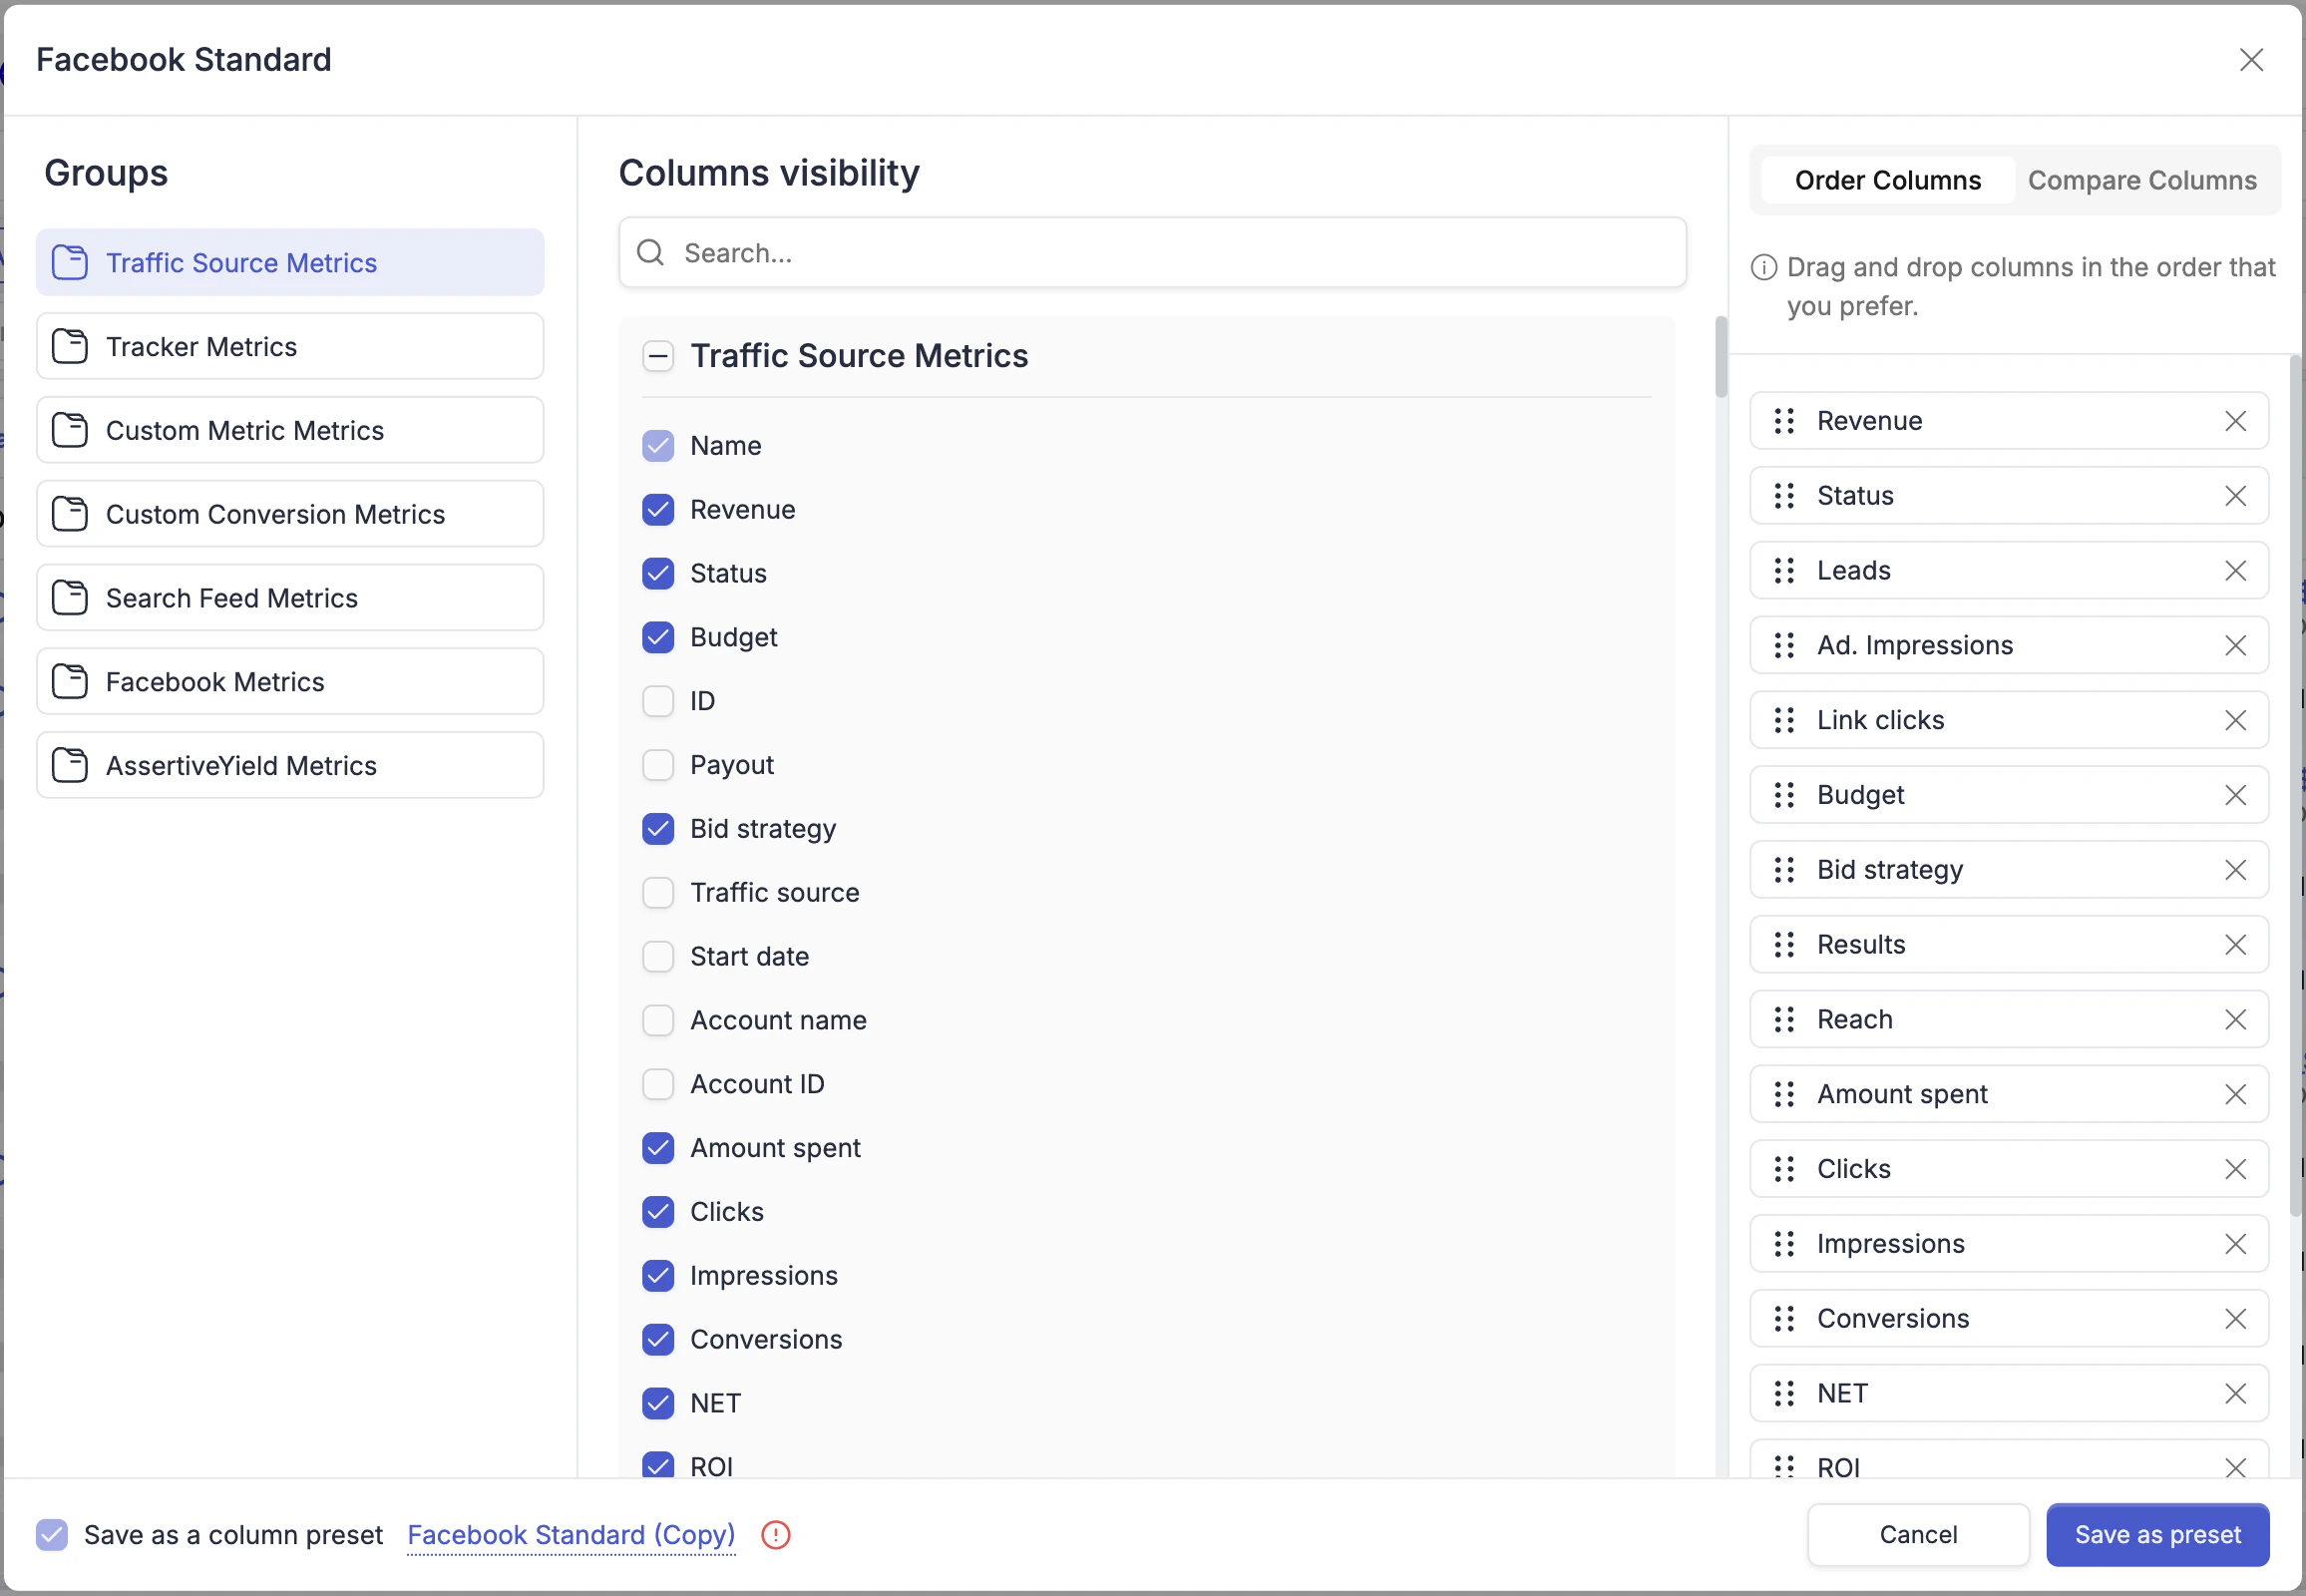
    Use the left panel to browse available column groups: **Traffic Source Metrics**, **Tracker Metrics**, **Custom Metric**, **Custom Conversion Metrics**, **Search Feed Metrics**, and network-specific groups (e.g., **Facebook Metrics**).
  </Step>

  <Step title="Select your columns">
    Check or uncheck columns in the center panel to show or hide them.
  </Step>

  <Step title="Reorder columns">
    Use the **Order Columns** panel on the right to drag columns into the exact order you want.
  </Step>

  <Step title="Save as a preset">
    Any modification to a default view automatically prompts you to **Save as preset** under a new name. Your saved views appear at the top of the column list and can be switched between at any time.
  </Step>
</Steps>

<Tip>
  Create different presets for different workflows — for example, a "Daily Review" preset with spend, CPA, and ROI, and a separate "Creative Testing" preset focused on CTR, CPM, and click-through rate.
</Tip>

***

## Sharing Presets With Your Team

When saving a column preset, you will see a **Set to Public** toggle at the bottom of the Column Management dialog. Enabling it makes the preset visible to all sub-users in your TheOptimizer account — so your team can work from the same column views without each person having to recreate them manually.

<Frame>
  <img src="https://mintcdn.com/theoptimizer/d8i_PgwXHcJW-VUm/images/columns-share.png?fit=max&auto=format&n=d8i_PgwXHcJW-VUm&q=85&s=fc0732bacb28c2f22c3a2b58ab6ec7e5" alt="Columns Share" width="1156" height="889" data-path="images/columns-share.png" />
</Frame>

<Note>
  Presets are private by default. Only enable **Set to Public** for views you want to standardise across your team, such as a shared daily review layout or a company-wide reporting format.
</Note>