> ## Documentation Index
> Fetch the complete documentation index at: https://docs.theoptimizer.io/llms.txt
> Use this file to discover all available pages before exploring further.
# Bring Your Own Data
> Import any conversion, revenue, or custom event data from your own tracking systems into TheOptimizer — with full control over the metrics you define and support for both manual CSV uploads and automated API delivery.
Bring Your Own Data is a flexible integration designed for teams who use their own internal tracking systems or third-party platforms that aren't natively supported by TheOptimizer. Instead of being limited to a fixed set of importable fields, you define exactly which metrics matter to your workflow — and then push that data in via CSV or API.
***
## Why Bring Your Own Data
Before this integration, TheOptimizer's CSV and Google Sheets import options only supported a fixed structure: conversions, clicks, and revenue. That was sufficient for basic use cases but left teams unable to bring in richer data like custom sales events, add-to-cart actions, upsell completions, or any other metric tracked in their backend.
Bring Your Own Data solves two specific problems:
**1. Flexible metric definition.** You create your own fields — give each one a name, choose a type, and TheOptimizer treats it as a proper metric across reporting and automation. You can define up to 50 fields in total across all your Bring Your Own Data integrations.
**2. API-based submission.** In addition to manual CSV uploads, every Bring Your Own Data integration generates a unique API key and endpoint instructions, so your technical team can automate the entire data delivery process.
***
## The Bring Your Own Data View
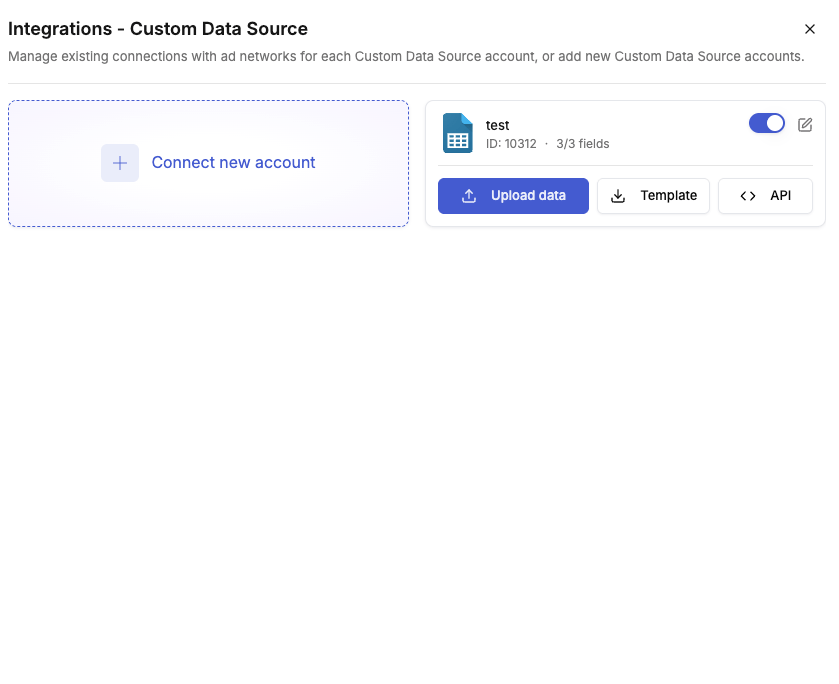
Navigate to **Integrations → Bring Your Own Data** to see all integrations you've created.
Each integration card shows the integration name and surfaces three quick actions directly on the card (see [Working with a Data Source](#working-with-a-data-source) below). You can create as many integrations as you need — for example, one per ad network, one per data provider, or one per team.
***
## Creating a Bring Your Own Data Integration
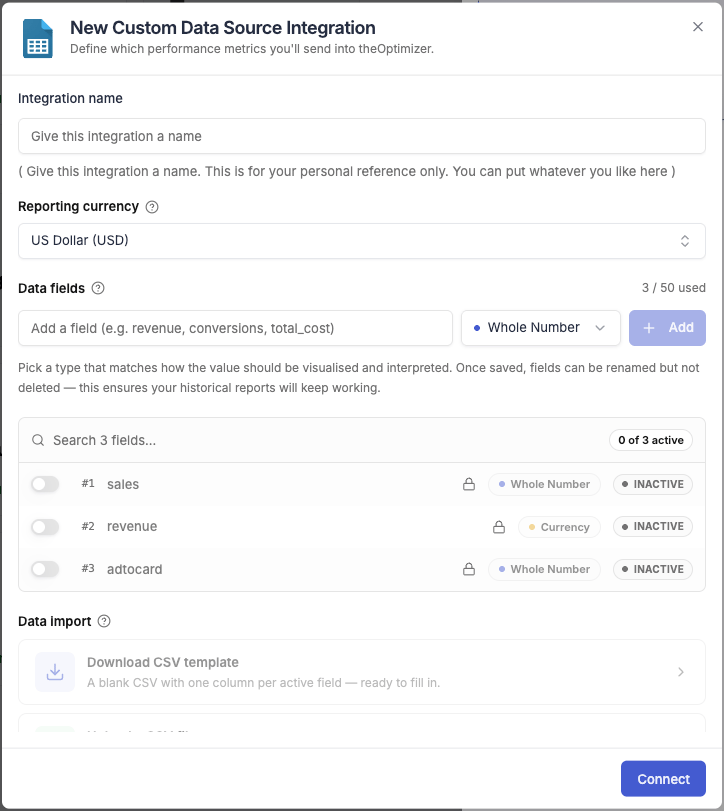
Click **Connect New Account** to open the configuration dialog.
### Integration Name
Give the integration a descriptive name that makes it easy to identify later — for example, `Internal CRM – US Revenue` or `Shopify Sales Data`. Since you can create multiple integrations, names that reflect the source or purpose are more useful than generic labels.
### Currency
Select the currency in which you'll be submitting data. This affects how all fields of type **Currency** are interpreted when they arrive.
If the ad accounts you're uploading data for use a different currency — for example, your data is in USD but your Taboola accounts report in EUR — TheOptimizer will automatically convert the submitted values to match each ad account's currency. You don't need to pre-convert your data; just select the currency your backend data is denominated in.
### Defining Data Fields
This is the core of the setup. Each data field becomes a column in your CSV template and a reportable metric in TheOptimizer.
To add a field: enter a name, select a type, and click **Add**. Repeat for every metric you want to import.
**Field types:**
| Type | Use when |
| ------------ | -------------------------------------------------------------------------------------- |
| **Number** | Whole-number counts — conversions, sales, clicks, add-to-cart events, page views, etc. |
| **Decimal** | Fractional values that aren't monetary — ratios, rates, scores |
| **Currency** | Monetary amounts — revenue, cost-per-sale, upsell value, etc. |
There is a **hard limit of 50 data fields total** across all Bring Your Own Data integrations in your account. If you've already created fields for one integration, those count toward this limit.
#### Reusing Fields Across Integrations
When you create a second (or third) Bring Your Own Data integration, you'll see a list of data fields already defined by your other integrations. You can toggle any of them **on** to include them in this integration's CSV template as well. Hovering over the lock icon on a field shows which integration owns it, its type, and its current status.
#### Active vs. Inactive Fields
Toggling a field off does **not** remove it from TheOptimizer's reporting or hide its data. It only removes that field from the downloaded CSV template for this integration, giving you a more compact upload file. If you stop tracking a particular metric temporarily, turning off its field keeps your CSV tidy without losing any historical data.
***
## Working with a Data Source
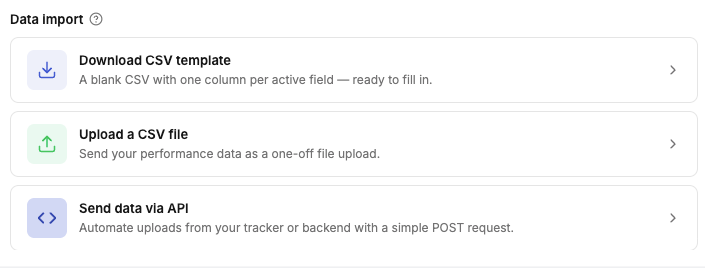
Once a Bring Your Own Data integration is created, three actions are available — directly from the card in the list view, or by opening **Edit**.
### Download CSV Template
Downloads a pre-formatted CSV file containing all your active data fields as column headers, plus the required system columns. The filename matches the integration name. Use this template as the base for every upload — do not add or rename columns manually.
See [CSV Format & Upload Guide](/integrations/bring-your-own-data/csv-guide) for a full explanation of how to fill in the template correctly.
### Upload CSV
Opens a file picker to upload a completed CSV directly. This is the manual upload path — useful for one-off imports or when you're not yet ready to automate via API.
You can also access this by clicking **Edit** on the integration and using the upload fields there.
### Send Data via API
Opens a dialog with everything needed to automate data submission programmatically:
* A **unique API key** scoped to this specific integration
* **Endpoint and request instructions** for sending the CSV file via API call
Hand these details to your technical team to build an automated pipeline — for example, a nightly job that generates the CSV from your backend and posts it to TheOptimizer automatically.
***
## Editing a Bring Your Own Data Integration
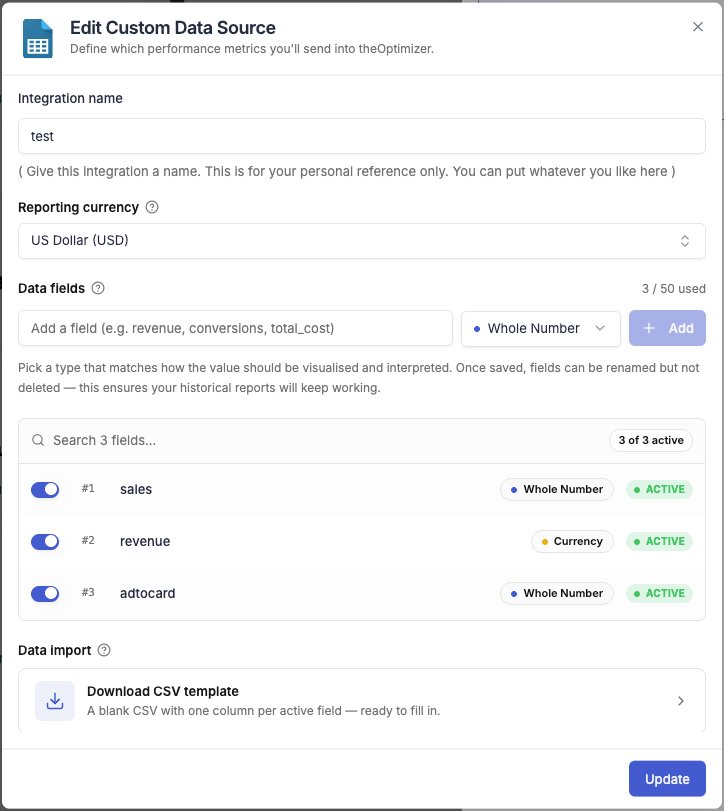
Click **Edit** on any integration card to open the same configuration dialog used during creation. From here you can:
* Rename the integration
* Change the currency
* Add new data fields or deactivate existing ones
* Access the upload and API panels
 Each integration card shows the integration name and surfaces three quick actions directly on the card (see [Working with a Data Source](#working-with-a-data-source) below). You can create as many integrations as you need — for example, one per ad network, one per data provider, or one per team.
***
## Creating a Bring Your Own Data Integration
Click **Connect New Account** to open the configuration dialog.
Each integration card shows the integration name and surfaces three quick actions directly on the card (see [Working with a Data Source](#working-with-a-data-source) below). You can create as many integrations as you need — for example, one per ad network, one per data provider, or one per team.
***
## Creating a Bring Your Own Data Integration
Click **Connect New Account** to open the configuration dialog.
 ### Integration Name
Give the integration a descriptive name that makes it easy to identify later — for example, `Internal CRM – US Revenue` or `Shopify Sales Data`. Since you can create multiple integrations, names that reflect the source or purpose are more useful than generic labels.
### Currency
Select the currency in which you'll be submitting data. This affects how all fields of type **Currency** are interpreted when they arrive.
### Integration Name
Give the integration a descriptive name that makes it easy to identify later — for example, `Internal CRM – US Revenue` or `Shopify Sales Data`. Since you can create multiple integrations, names that reflect the source or purpose are more useful than generic labels.
### Currency
Select the currency in which you'll be submitting data. This affects how all fields of type **Currency** are interpreted when they arrive.
 ### Download CSV Template
Downloads a pre-formatted CSV file containing all your active data fields as column headers, plus the required system columns. The filename matches the integration name. Use this template as the base for every upload — do not add or rename columns manually.
See [CSV Format & Upload Guide](/integrations/bring-your-own-data/csv-guide) for a full explanation of how to fill in the template correctly.
### Upload CSV
Opens a file picker to upload a completed CSV directly. This is the manual upload path — useful for one-off imports or when you're not yet ready to automate via API.
You can also access this by clicking **Edit** on the integration and using the upload fields there.
### Send Data via API
Opens a dialog with everything needed to automate data submission programmatically:
* A **unique API key** scoped to this specific integration
* **Endpoint and request instructions** for sending the CSV file via API call
Hand these details to your technical team to build an automated pipeline — for example, a nightly job that generates the CSV from your backend and posts it to TheOptimizer automatically.
***
## Editing a Bring Your Own Data Integration
Click **Edit** on any integration card to open the same configuration dialog used during creation. From here you can:
* Rename the integration
* Change the currency
* Add new data fields or deactivate existing ones
* Access the upload and API panels
### Download CSV Template
Downloads a pre-formatted CSV file containing all your active data fields as column headers, plus the required system columns. The filename matches the integration name. Use this template as the base for every upload — do not add or rename columns manually.
See [CSV Format & Upload Guide](/integrations/bring-your-own-data/csv-guide) for a full explanation of how to fill in the template correctly.
### Upload CSV
Opens a file picker to upload a completed CSV directly. This is the manual upload path — useful for one-off imports or when you're not yet ready to automate via API.
You can also access this by clicking **Edit** on the integration and using the upload fields there.
### Send Data via API
Opens a dialog with everything needed to automate data submission programmatically:
* A **unique API key** scoped to this specific integration
* **Endpoint and request instructions** for sending the CSV file via API call
Hand these details to your technical team to build an automated pipeline — for example, a nightly job that generates the CSV from your backend and posts it to TheOptimizer automatically.
***
## Editing a Bring Your Own Data Integration
Click **Edit** on any integration card to open the same configuration dialog used during creation. From here you can:
* Rename the integration
* Change the currency
* Add new data fields or deactivate existing ones
* Access the upload and API panels