> ## Documentation Index
> Fetch the complete documentation index at: https://docs.theoptimizer.io/llms.txt
> Use this file to discover all available pages before exploring further.
# Reports
> Build, save and share custom performance reports across every connected ad network — break down by campaign, ad, account or time, then group and filter the way you work.
Reports is where you build the views you keep coming back to: which campaigns are in profit this week, how each ad account is trending month over month, which sites carry your native campaigns, or how every team member's accounts are performing.
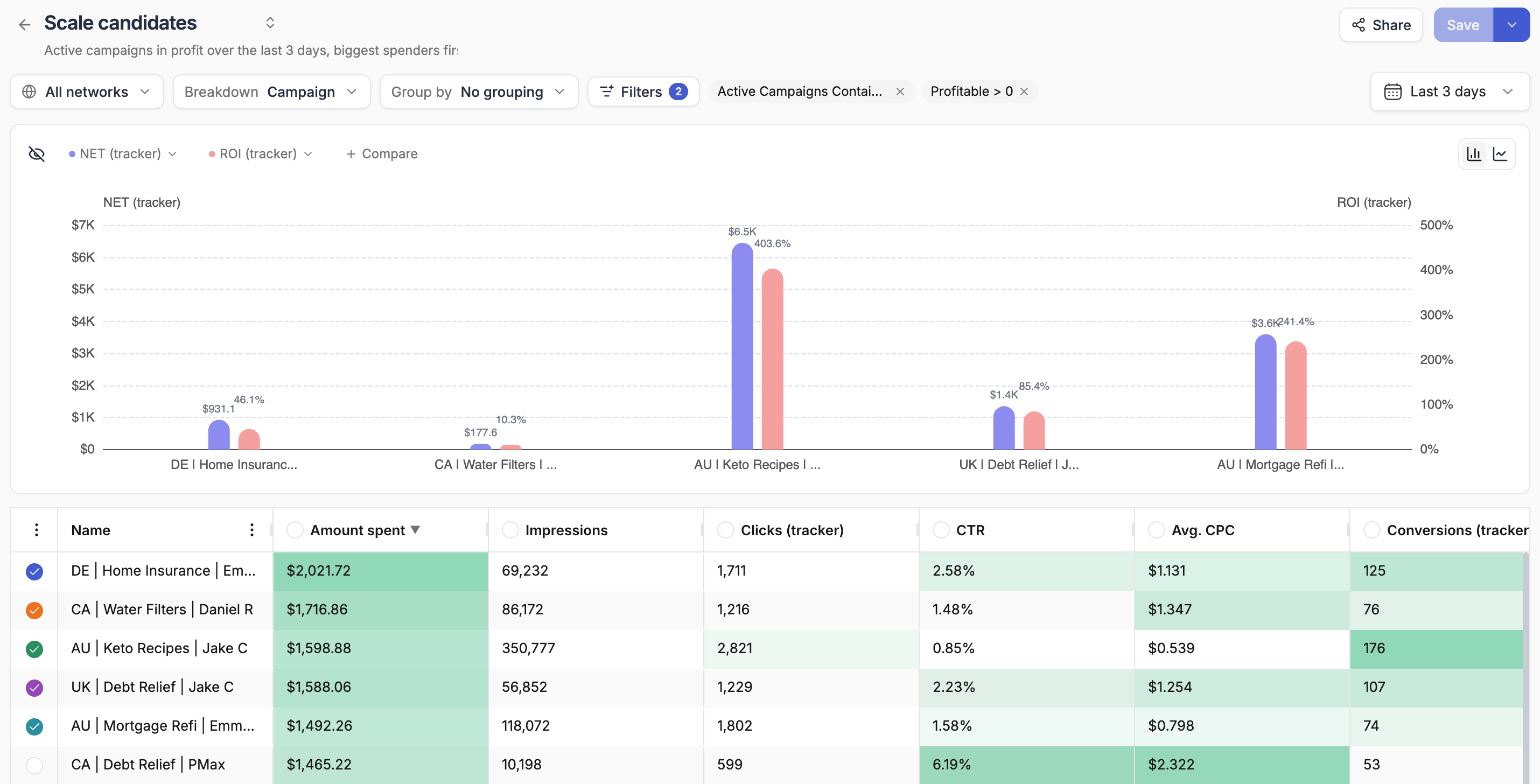
A report is a table and a chart built from a few choices — which ad network, what each row is (the breakdown), how rows are bucketed (the grouping), which filters apply and which date range to cover. Save it once and it's one click away from then on. Share it as a link and anyone can open a read-only copy without a TheOptimizer account.
 ***
## The Reports home page
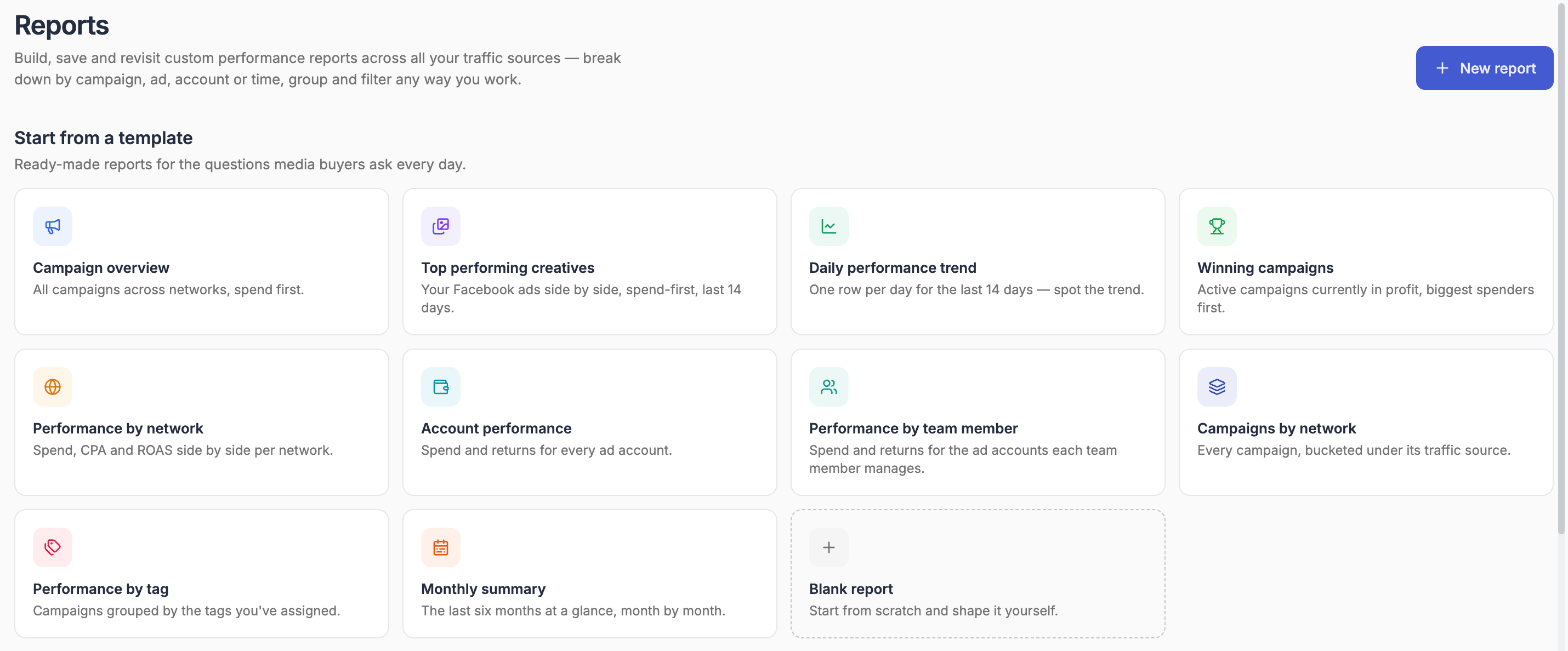
Click **Reports** in the left sidebar to open the Reports home page. It has two parts: a template gallery to start from, and the list of reports you have saved.
***
## The Reports home page
Click **Reports** in the left sidebar to open the Reports home page. It has two parts: a template gallery to start from, and the list of reports you have saved.
 ### Starting from a template
Under **Start from a template**, pick a ready-made report for a question media buyers ask every day. The template opens as a new, unsaved report — adjust anything you like, then save it under your own name.
| Template | What it shows |
| ------------------------------ | --------------------------------------------------------------- |
| **Campaign overview** | Every campaign across all your ad networks, highest spend first |
| **Top performing creatives** | Your Facebook ads side by side, highest spend first |
| **Daily performance trend** | One row per day, so the trend is easy to read |
| **Winning campaigns** | Active campaigns that are currently profitable |
| **Performance by network** | Spend, CPA and ROAS for each ad network side by side |
| **Account performance** | Spend and returns for every ad account |
| **Performance by team member** | Spend and returns for the ad accounts each team member manages |
| **Campaigns by network** | Every campaign, grouped under its ad network |
| **Performance by tag** | Campaigns grouped by the tags you've assigned |
| **Monthly summary** | The last six months, one row per month |
| **Blank report** | Start from scratch and shape it yourself |
Templates cover the last 14 days, except **Monthly summary**, which covers the last six months. **Performance by team member** only appears when your plan includes [team members](/account-settings/team-members).
**Winning campaigns** is the one template that ships with filters already set — *Active* and *Profitable*. Open it to see how filters work in a report, then change them to match your own definition of a winner.
You can also click **New report** in the top-right corner to open a blank report. A blank report starts on all networks, broken down by ad network, for today.
### Your saved reports
**Your reports** lists every report you've saved, with a summary of how each one is built:
### Starting from a template
Under **Start from a template**, pick a ready-made report for a question media buyers ask every day. The template opens as a new, unsaved report — adjust anything you like, then save it under your own name.
| Template | What it shows |
| ------------------------------ | --------------------------------------------------------------- |
| **Campaign overview** | Every campaign across all your ad networks, highest spend first |
| **Top performing creatives** | Your Facebook ads side by side, highest spend first |
| **Daily performance trend** | One row per day, so the trend is easy to read |
| **Winning campaigns** | Active campaigns that are currently profitable |
| **Performance by network** | Spend, CPA and ROAS for each ad network side by side |
| **Account performance** | Spend and returns for every ad account |
| **Performance by team member** | Spend and returns for the ad accounts each team member manages |
| **Campaigns by network** | Every campaign, grouped under its ad network |
| **Performance by tag** | Campaigns grouped by the tags you've assigned |
| **Monthly summary** | The last six months, one row per month |
| **Blank report** | Start from scratch and shape it yourself |
Templates cover the last 14 days, except **Monthly summary**, which covers the last six months. **Performance by team member** only appears when your plan includes [team members](/account-settings/team-members).
**Winning campaigns** is the one template that ships with filters already set — *Active* and *Profitable*. Open it to see how filters work in a report, then change them to match your own definition of a winner.
You can also click **New report** in the top-right corner to open a blank report. A blank report starts on all networks, broken down by ad network, for today.
### Your saved reports
**Your reports** lists every report you've saved, with a summary of how each one is built:
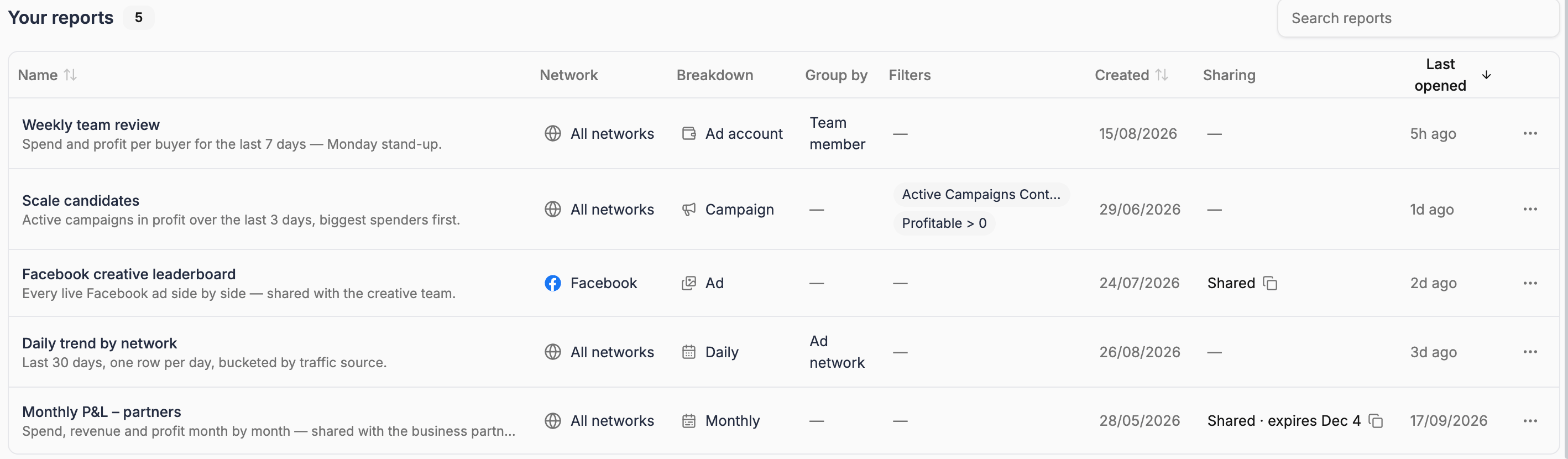 | Column | What it shows |
| --------------- | ---------------------------------------------------------------------------------- |
| **Name** | The report's name and description |
| **Network** | The ad network the report covers, or all of them |
| **Breakdown** | What each row of the report is — campaign, ad account, day and so on |
| **Group by** | How rows are bucketed, if at all |
| **Filters** | The report's filters — the first few are shown, and **+N** lists the rest on hover |
| **Created** | When the report was first saved |
| **Sharing** | Whether the report has a live share link, and when it expires |
| **Last opened** | When you last opened the report |
Click a row to open the report. Use **Search reports** to find one by name, and click the **Name**, **Created** or **Last opened** headers to sort.
The **⋯** menu at the end of each row holds:
* **Share…** — create or manage the report's share link. See [Sharing reports](/reports/sharing)
* **Duplicate** — copy the report, to build a variation without touching the original
* **Delete** — remove the report permanently. This can't be undone
When a report is shared, a copy icon next to its sharing status copies the link without opening the report.
***
## How a report is built
Every report is the same set of controls along the top of the page, applied from left to right:
**All networks**, or one connected ad network.
What each row is — an ad network, an ad account, a campaign (or an ad set, ad or site on a single network), a day or a month.
Optionally bucket the rows — by ad account, status, tag, team member, a set of custom groups and more.
Narrow the rows down and choose the period the numbers cover.
Below the controls, a chart compares the rows you pick, and the table shows the numbers with a **Net Results** totals row.
Network, breakdown, grouping, filters, dates, currency, chart, columns and export.
Group by tags, ad account attributes, or your own custom groups.
Save, copy, rename and switch between reports.
Send a read-only link to a client or colleague — no login needed.
***
## Reports and the Dashboard
The [Dashboard](/dashboard/overview) and Reports answer different questions. The Dashboard is a board of widgets you glance at — a KPI here, a top-5 there — each with its own metric and ad network. A report is one question answered in depth: a full table you can break down, group, filter, chart and export row by row.
A common setup is a Dashboard for the morning check, and a handful of saved reports for the questions it raises.
| Column | What it shows |
| --------------- | ---------------------------------------------------------------------------------- |
| **Name** | The report's name and description |
| **Network** | The ad network the report covers, or all of them |
| **Breakdown** | What each row of the report is — campaign, ad account, day and so on |
| **Group by** | How rows are bucketed, if at all |
| **Filters** | The report's filters — the first few are shown, and **+N** lists the rest on hover |
| **Created** | When the report was first saved |
| **Sharing** | Whether the report has a live share link, and when it expires |
| **Last opened** | When you last opened the report |
Click a row to open the report. Use **Search reports** to find one by name, and click the **Name**, **Created** or **Last opened** headers to sort.
The **⋯** menu at the end of each row holds:
* **Share…** — create or manage the report's share link. See [Sharing reports](/reports/sharing)
* **Duplicate** — copy the report, to build a variation without touching the original
* **Delete** — remove the report permanently. This can't be undone
When a report is shared, a copy icon next to its sharing status copies the link without opening the report.
***
## How a report is built
Every report is the same set of controls along the top of the page, applied from left to right:
**All networks**, or one connected ad network.
What each row is — an ad network, an ad account, a campaign (or an ad set, ad or site on a single network), a day or a month.
Optionally bucket the rows — by ad account, status, tag, team member, a set of custom groups and more.
Narrow the rows down and choose the period the numbers cover.
Below the controls, a chart compares the rows you pick, and the table shows the numbers with a **Net Results** totals row.
Network, breakdown, grouping, filters, dates, currency, chart, columns and export.
Group by tags, ad account attributes, or your own custom groups.
Save, copy, rename and switch between reports.
Send a read-only link to a client or colleague — no login needed.
***
## Reports and the Dashboard
The [Dashboard](/dashboard/overview) and Reports answer different questions. The Dashboard is a board of widgets you glance at — a KPI here, a top-5 there — each with its own metric and ad network. A report is one question answered in depth: a full table you can break down, group, filter, chart and export row by row.
A common setup is a Dashboard for the morning check, and a handful of saved reports for the questions it raises.