
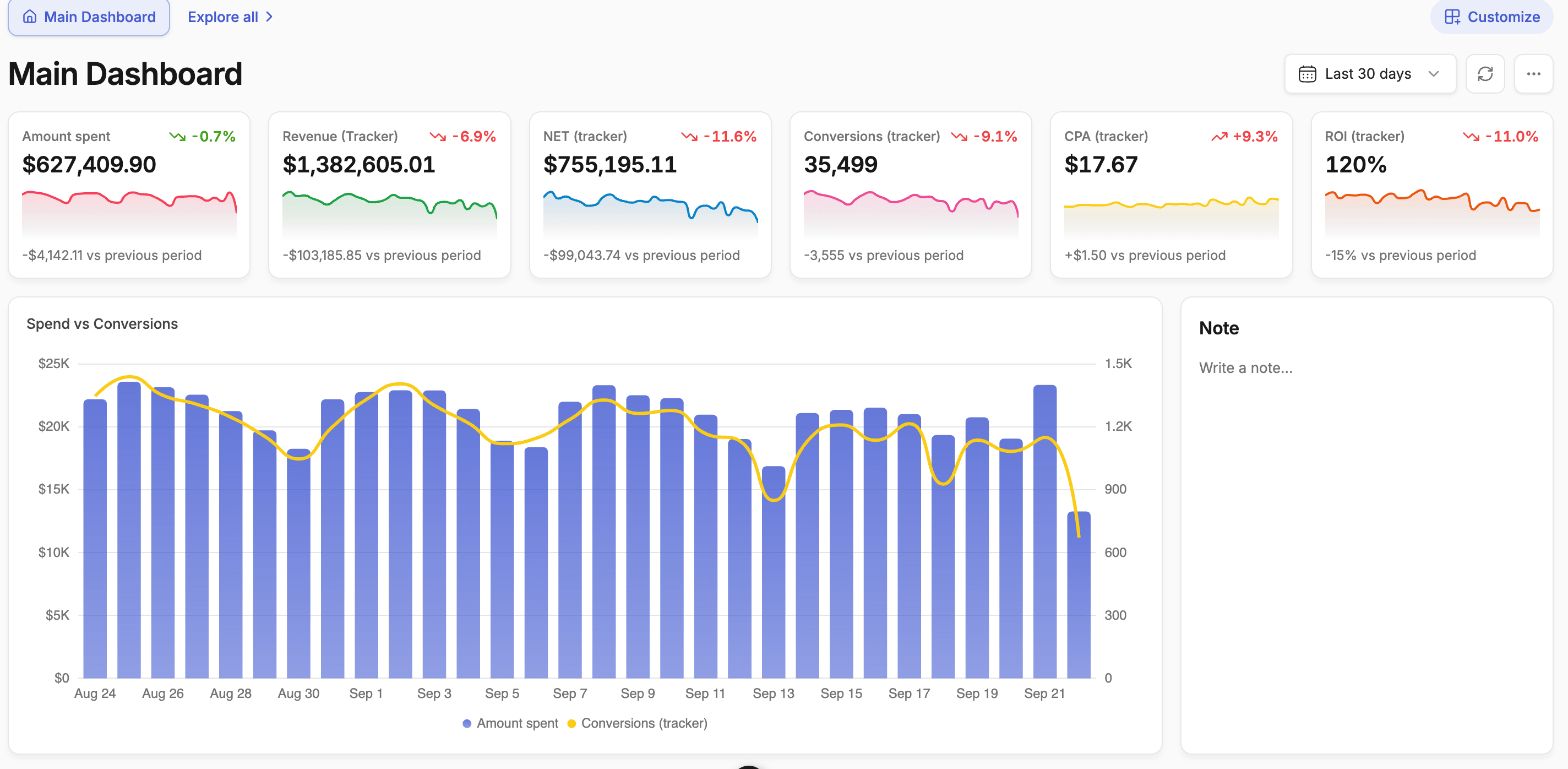
Working with multiple dashboards
Your dashboards appear as tabs along the top of the page. Explore all opens the Boards page, which lists every dashboard you have with its badges — Pinned, Default, Permanent.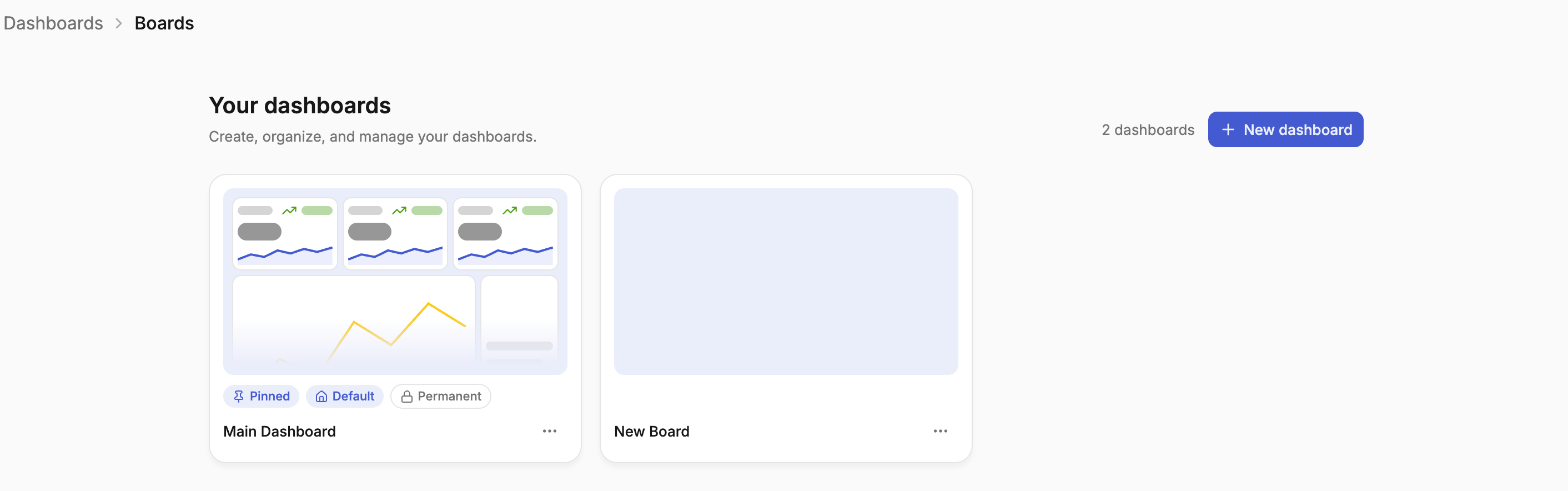
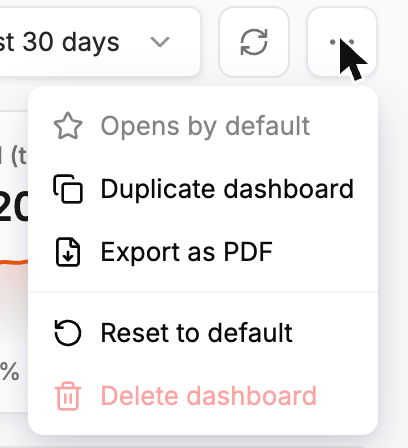
- Set as default — the board that opens when you land on the page. On the board that already is, it reads Opens by default
- Duplicate dashboard — copy a board and adapt it, instead of rebuilding from scratch
- Export as PDF — see Exporting as PDF below
- Reset to default — return the board to the layout it started from
- Delete dashboard — remove a board you no longer use
Starting from a template
Click + New dashboard on the Boards page — or + next to the dashboard tabs — to create a board. You can start from a template or from an empty board.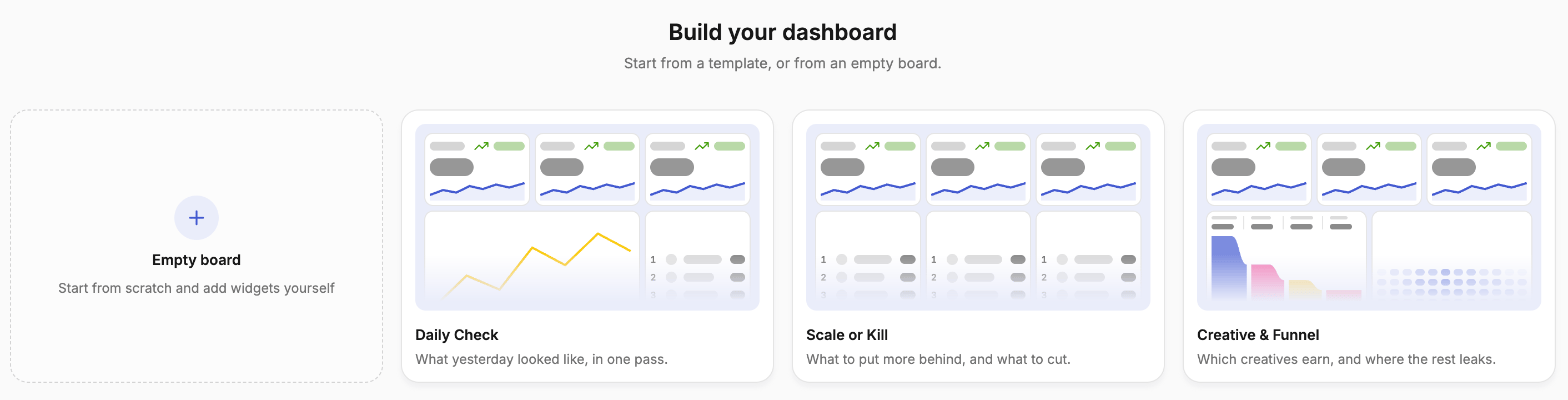
Templates are a starting point, not a constraint — every widget on them can be edited, moved or removed.
Building and editing a board
1
Enter edit mode
Click Customize on the dashboard you want to change. The header switches to Customizing this board · Save to keep.
2
Add widgets
Click Add widget to open the widget panel, then drag a widget onto the grid — or click one to place it and go straight into its options. See Widget Types for what each one does.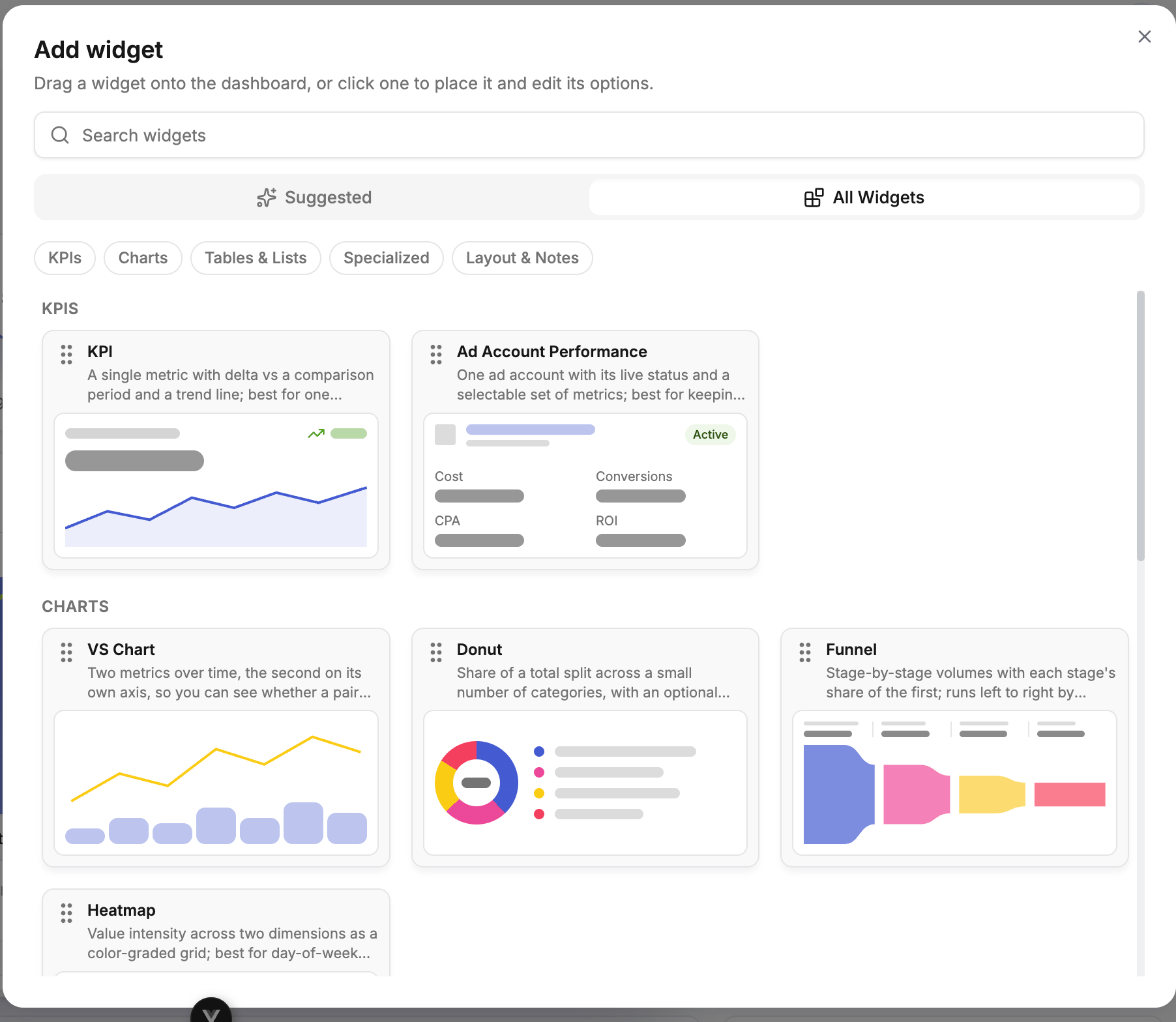
3
Configure each widget
Set the title, the ad network, the metric and any widget-specific options. Each widget is configured independently.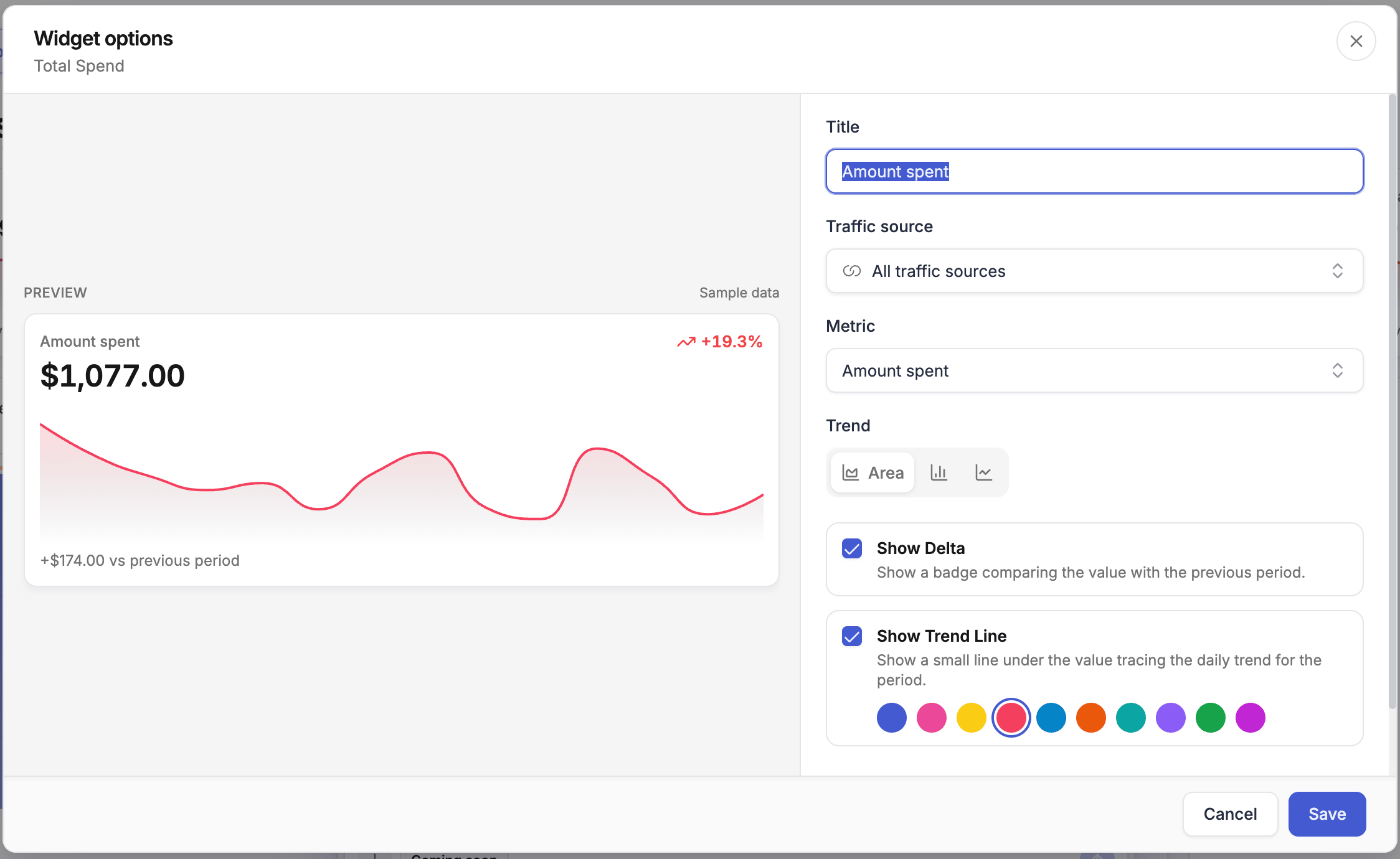
4
Arrange the grid
Drag widgets to reposition them and drag their edges to resize. Hovering a widget also gives you Edit, duplicate and remove.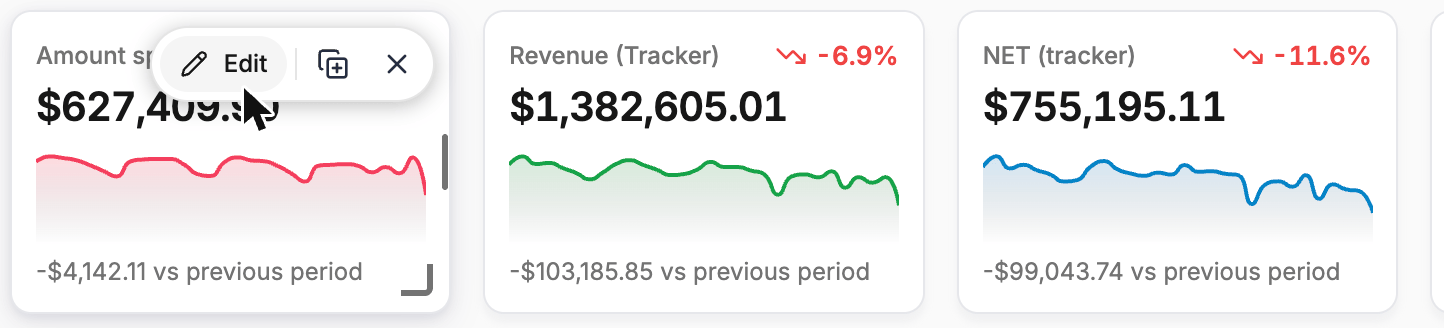
5
Save or cancel
Save commits the whole edit. Cancel discards every change you made in this session, not just the last one.
Editing is transactional — save and cancel apply to the entire edit session. If you want to keep some changes and discard others, save first, then make the changes you’re unsure about as a second edit.
Choosing metrics
The metric picker only offers metrics your connected ad networks actually report. The left rail groups them by where they come from — Traffic Source for the numbers the networks report themselves, Tracker for your tracking platform, Custom for your own formulas, plus a group per connected network.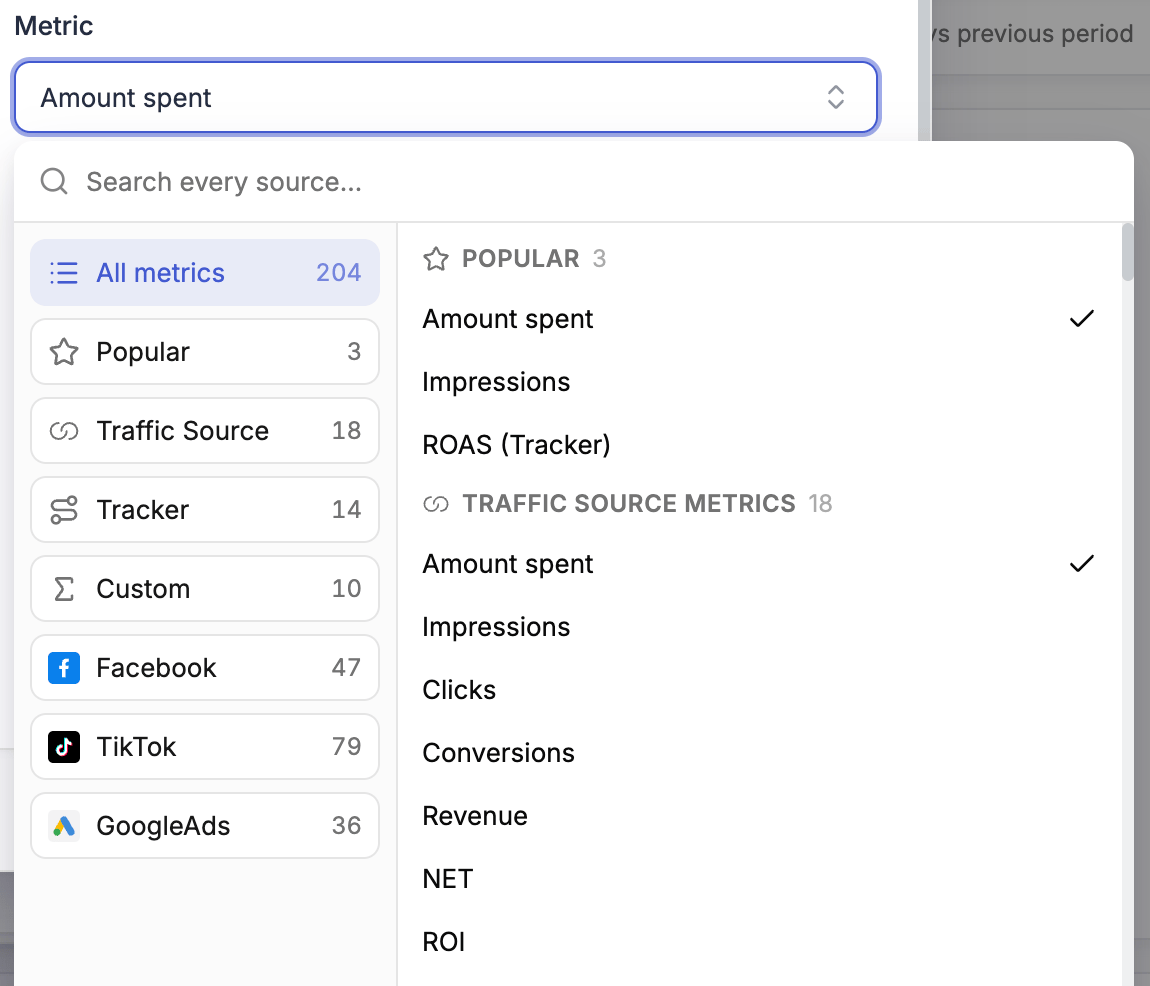
Per-widget ad network
Each widget can be pinned to a single ad network — Facebook, TikTok, Taboola, Outbrain and so on — or left across all of them. In the widget’s options this is the Traffic source field; leave it on All traffic sources to report across everything.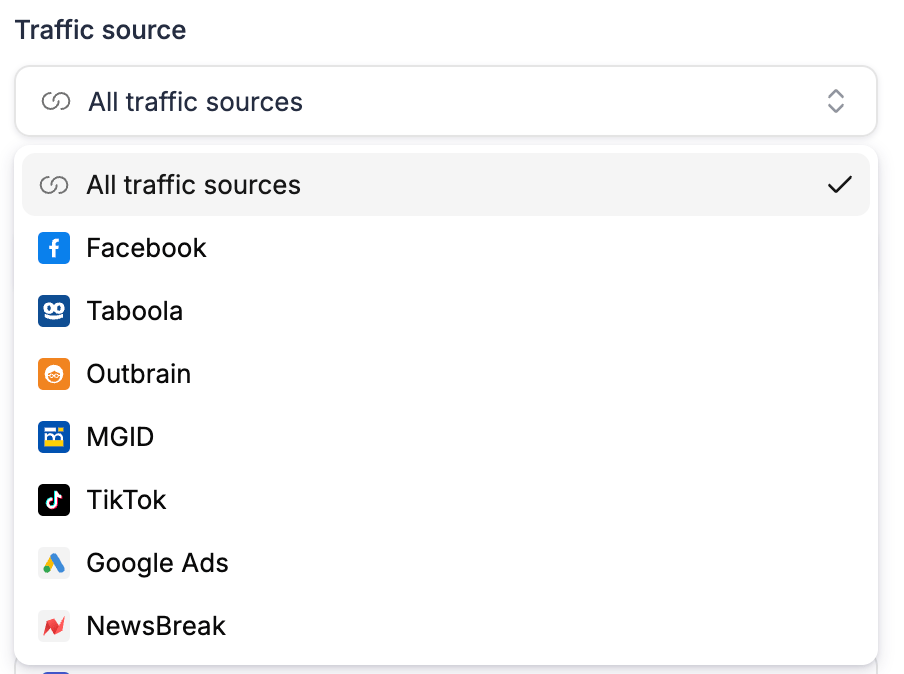
Date range and comparison
The dashboard has one date range, set at board level and applied to every widget.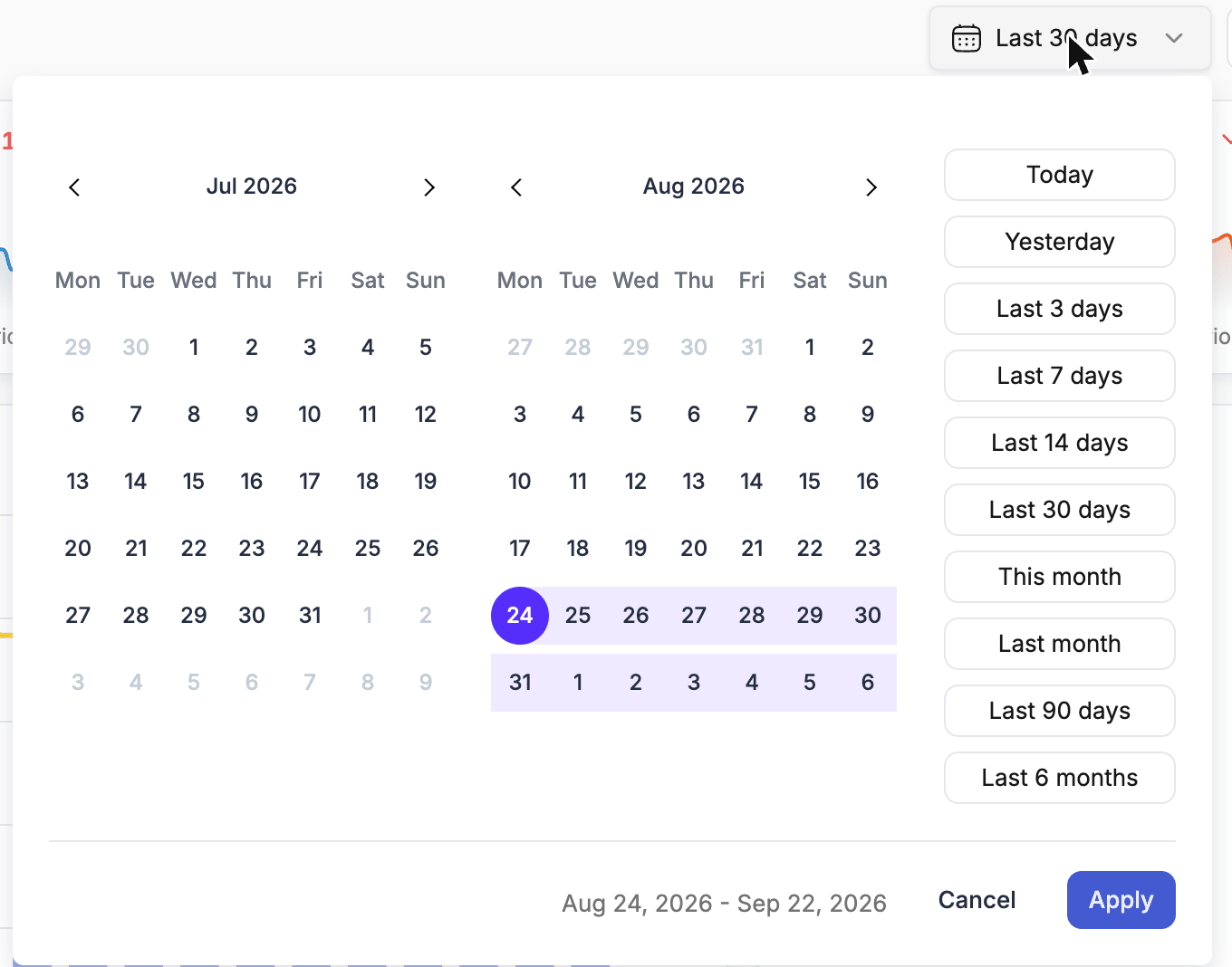
Drilling down
Click a row inside a widget and that campaign opens in place, with its details, linked rules, performance chart and recent events — plus Performance, Logs and Manage tabs.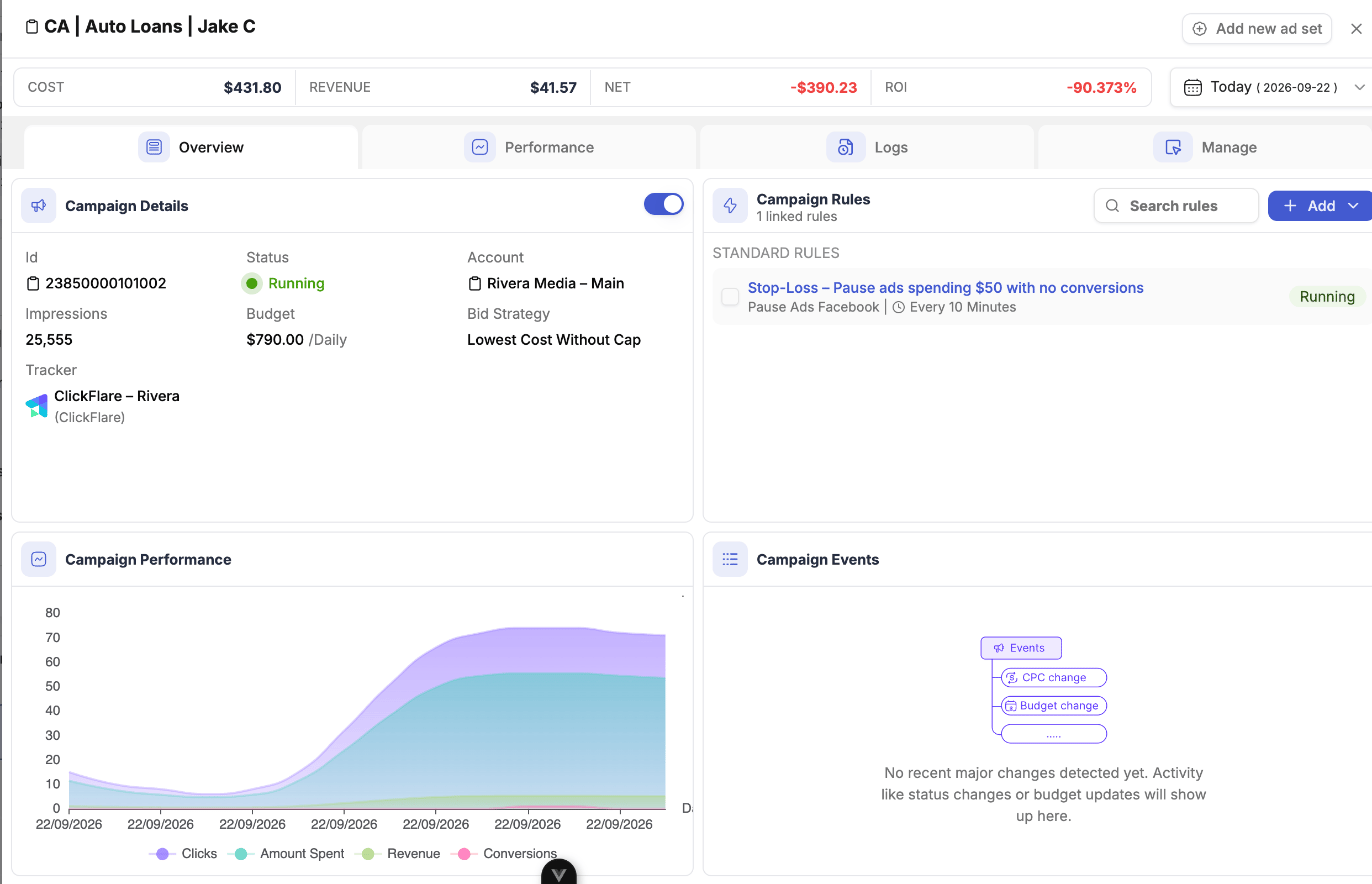
Exporting as PDF
Export the entire board as a paginated PDF for clients and stakeholders from the ⋯ menu. The export reflects the board as configured — its widgets and its date range — so building a client board once replaces rebuilding the same report every month.Finding the right widget
The Add widget panel opens on Suggested, a shortlist of ready-made widgets for the questions most boards start with — total spend, net profit, ROI, top spenders, top converting campaigns. Switch to All Widgets for the full catalogue grouped by kind, or search by name.Next steps
Widget Types
What each of the thirteen widget types shows and when to reach for it.
Custom Metrics
Define your own metric formulas and use them on any widget.