
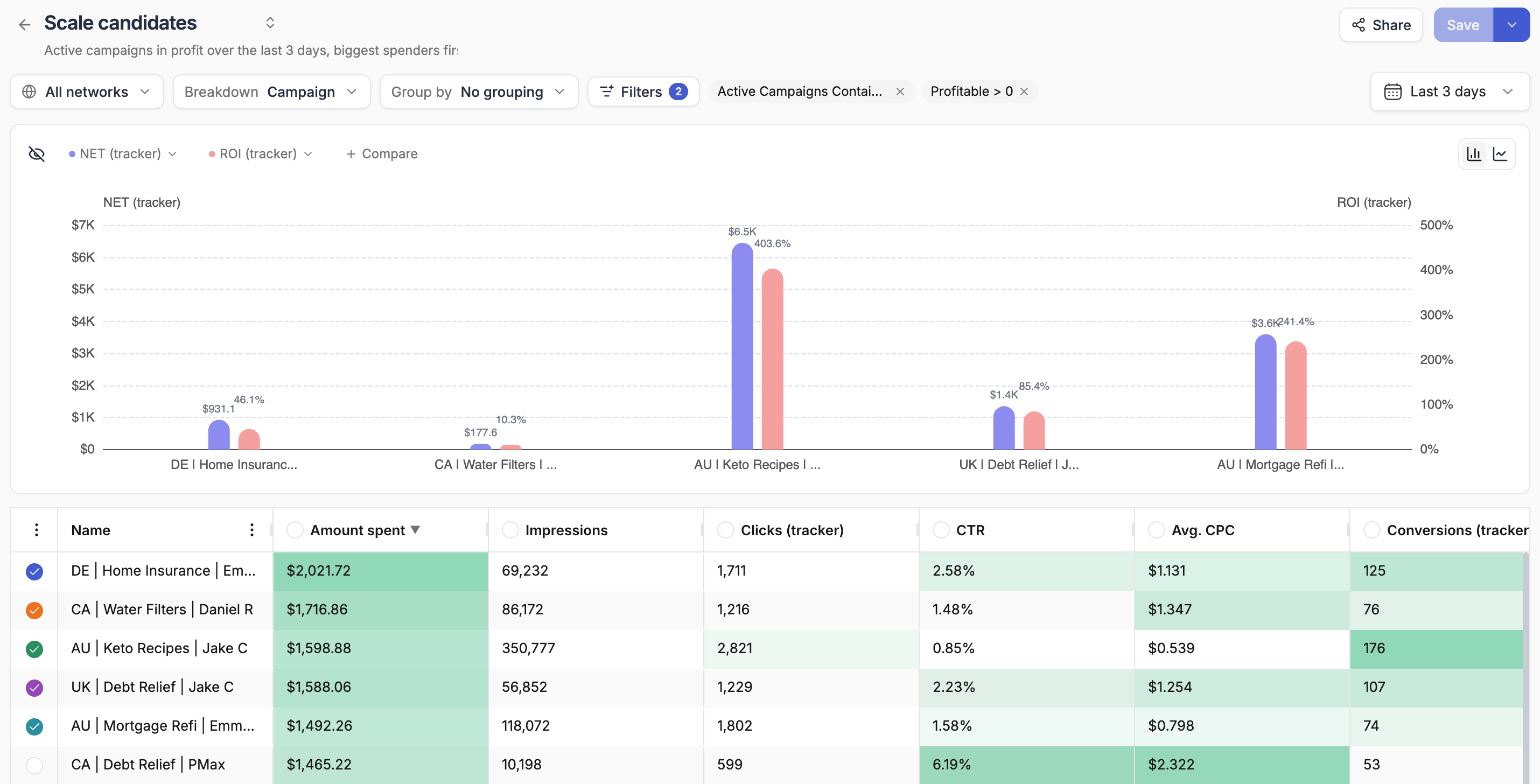
The Reports home page
Click Reports in the left sidebar to open the Reports home page. It has two parts: a template gallery to start from, and the list of reports you have saved.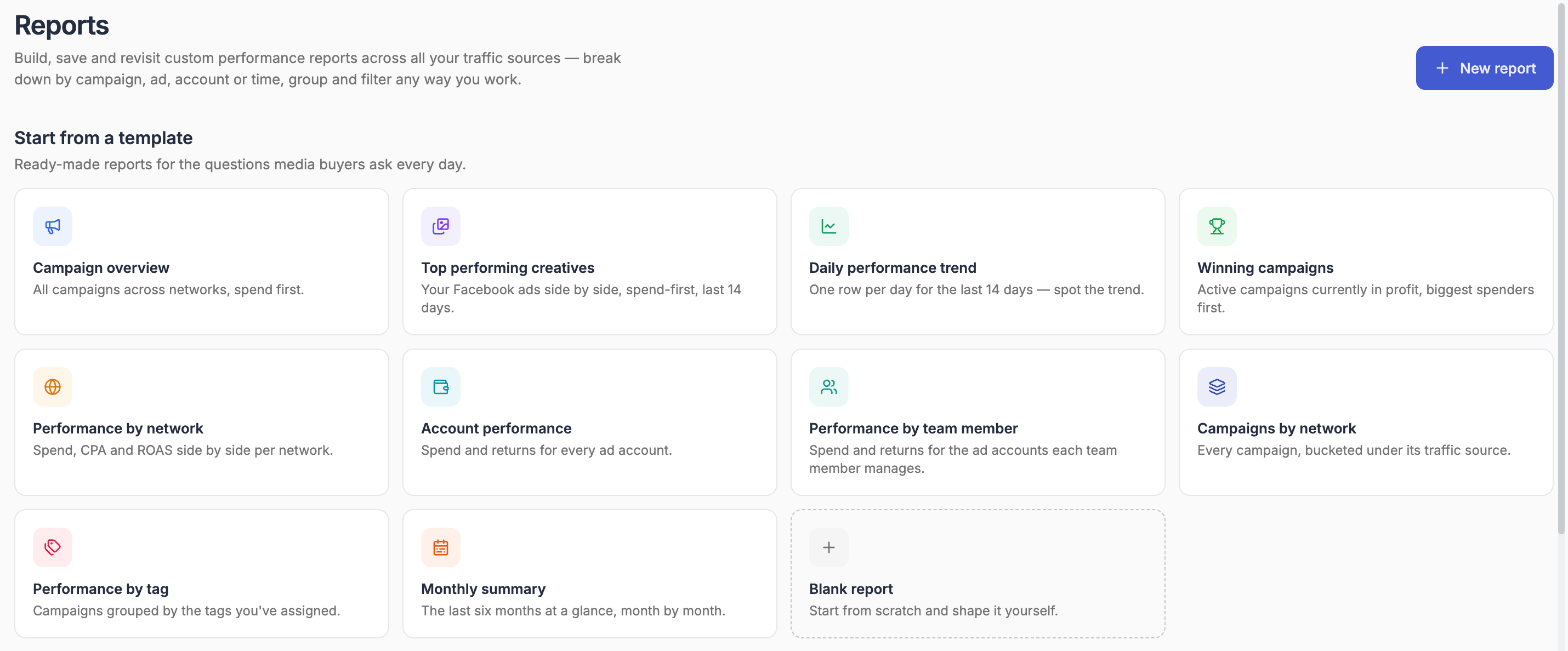
Starting from a template
Under Start from a template, pick a ready-made report for a question media buyers ask every day. The template opens as a new, unsaved report — adjust anything you like, then save it under your own name.
Templates cover the last 14 days, except Monthly summary, which covers the last six months. Performance by team member only appears when your plan includes team members.
You can also click New report in the top-right corner to open a blank report. A blank report starts on all networks, broken down by ad network, for today.
Your saved reports
Your reports lists every report you’ve saved, with a summary of how each one is built: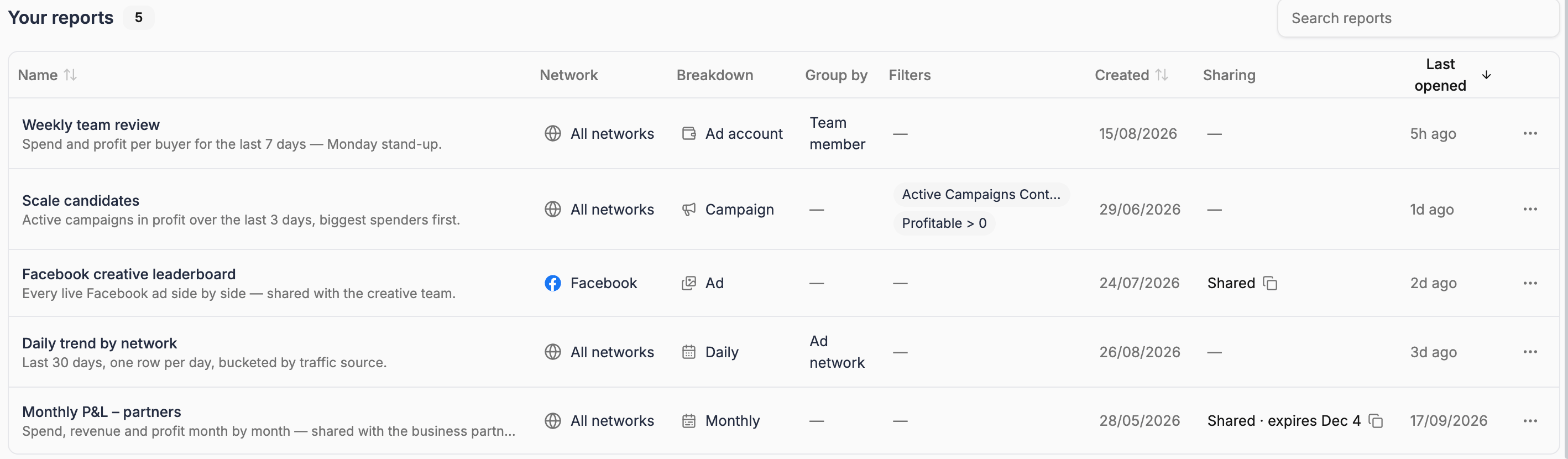
Click a row to open the report. Use Search reports to find one by name, and click the Name, Created or Last opened headers to sort.
The ⋯ menu at the end of each row holds:
- Share… — create or manage the report’s share link. See Sharing reports
- Duplicate — copy the report, to build a variation without touching the original
- Delete — remove the report permanently. This can’t be undone
How a report is built
Every report is the same set of controls along the top of the page, applied from left to right:1
Network
All networks, or one connected ad network.
2
Breakdown
What each row is — an ad network, an ad account, a campaign (or an ad set, ad or site on a single network), a day or a month.
3
Group by
Optionally bucket the rows — by ad account, status, tag, team member, a set of custom groups and more.
4
Filters and date range
Narrow the rows down and choose the period the numbers cover.
Build a report
Network, breakdown, grouping, filters, dates, currency, chart, columns and export.
Group rows
Group by tags, ad account attributes, or your own custom groups.
Save and manage reports
Save, copy, rename and switch between reports.
Share reports
Send a read-only link to a client or colleague — no login needed.