
Create a report
Click Create report in the Ad Library sidebar. Pick the platform at the top of the dialog — a report reads one platform, chosen when you create it — then start from a blank canvas, or pick a template that already asks the right question.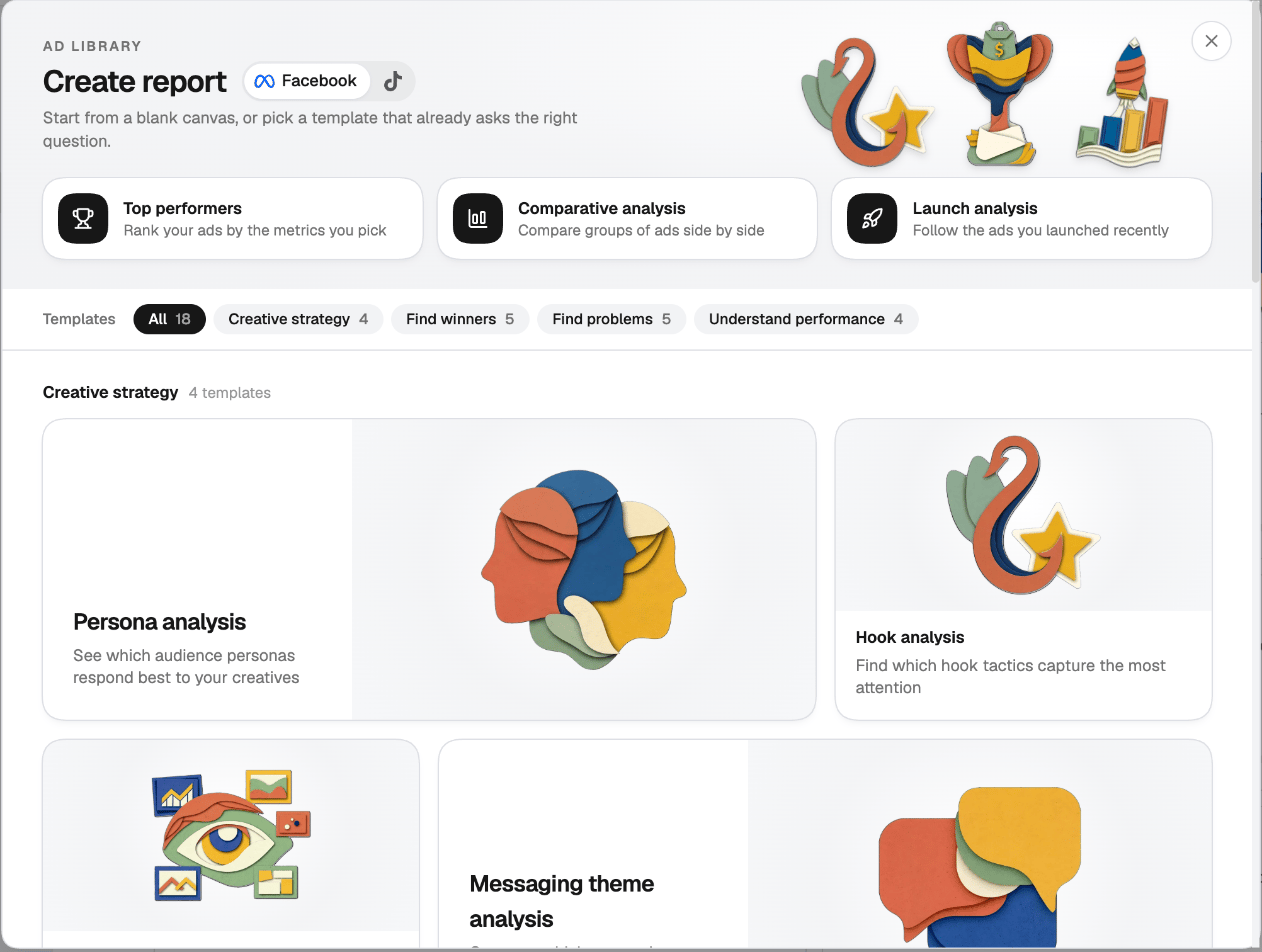
Blank reports
Templates
Templates start you on a ready report you can then change like any other.
A template that needs a metric the selected platform doesn’t report is shown as unavailable, with the reason.
Top performers
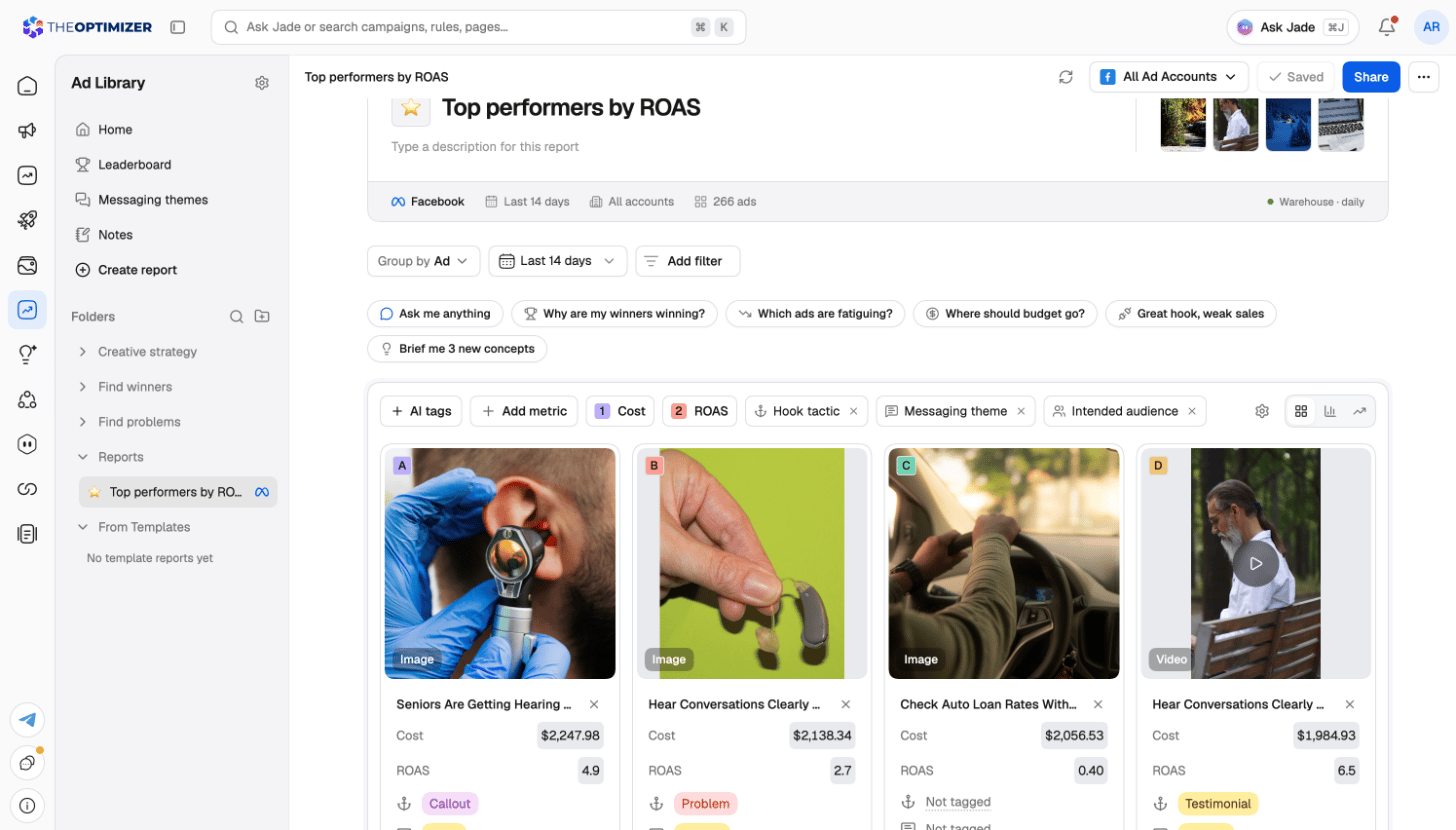
A Top performers report lists your creatives, ranked by the metrics you choose, over a date range (the last 14 days by default).- Pick metrics and columns. Add or remove metrics, use a column preset, and reorder the columns.
- Filter. Click Add filter to filter by any attribute (such as ad type, AI tag or campaign name) or metric. Metric filters let you keep only rows above or below a threshold, for example spend over $250.
- Cards and charts on top, the table below. The panel at the top shows the ads you’ve selected as cards with their thumbnails, as a bar chart or as a trend over time — switch with the icons at its top right. The table underneath lists every ad; tick rows to choose what the panel shows.
- Add AI tags. Click AI tags to show tags such as hook tactic, messaging theme or intended audience on every card and as table columns.
- Table settings. Highlight high and low values, and show or hide tags, the active status, the launch date and the ad length.
Comparative analysis
A comparative report groups your ads by a property — an AI tag like Hook or Persona, a custom tag, or a value read from your naming convention — and compares the groups on a chart and in a table. Use Group by to choose the property. The report adds a group automatically for every new value that appears. To control the groups yourself, choose Edit groups manually; the report then stops adding groups for new values.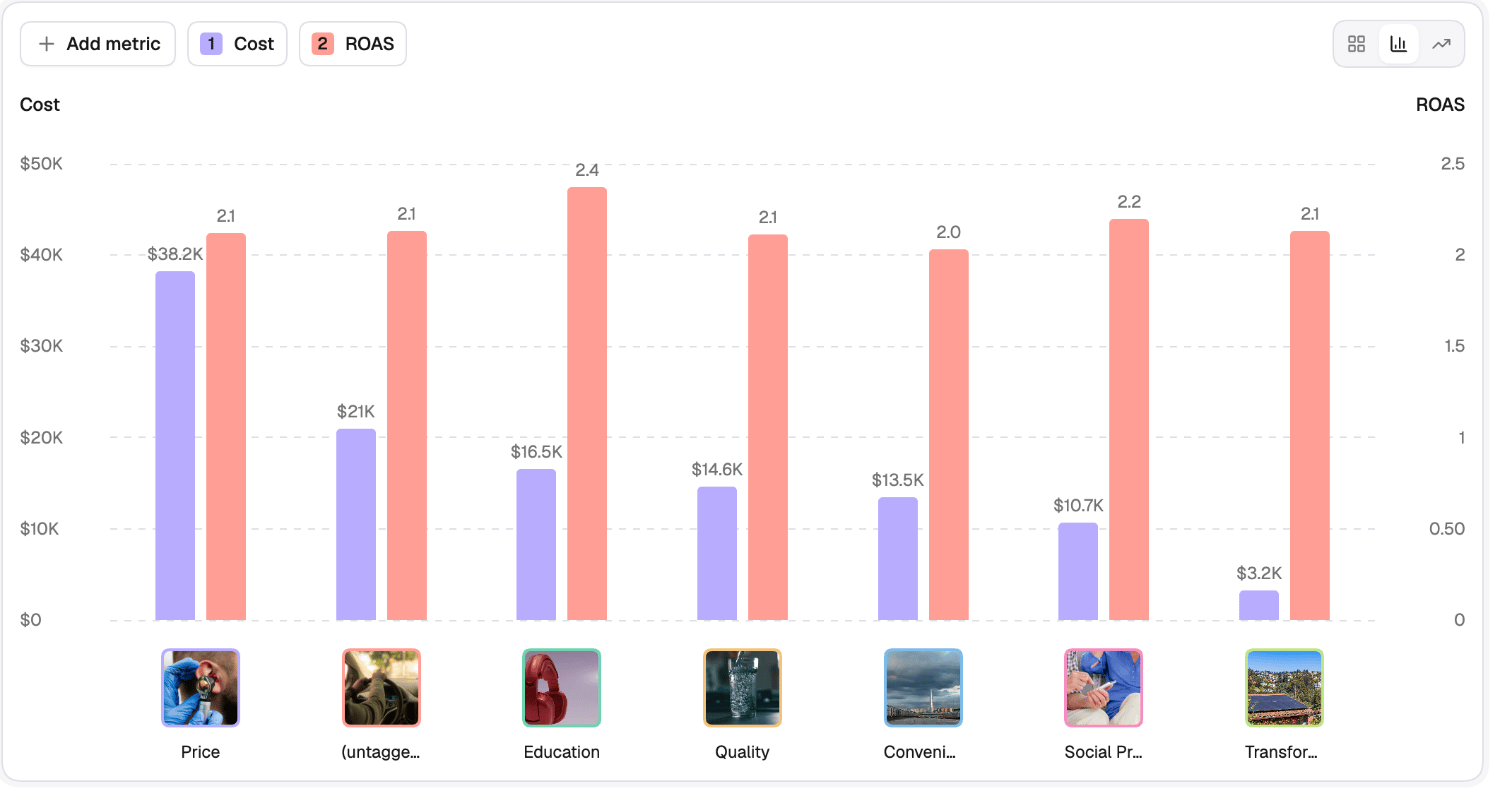
Launch analysis
A launch report follows the creatives you launched recently, week by week, in three stages:
The goal chip at the top shows both thresholds, for example ROAS > 3, Spend > $250. Show each week as a Table or as Cards, and add AI tags to see what the winners have in common.
Working with a saved report
The bar at the top of a report holds its actions:
The header under the title shows the report’s platform, date range, ad accounts and where each metric comes from, with how fresh it is.
Above the results, Ask me anything sends a question about the report to Jade, next to suggested questions such as Why are my winners winning? or Which ads are fatiguing?
Organizing reports
Saved reports are listed under Reports in the sidebar. Create folders with New folder, drag reports into them, and use Search to find one by name. Each report’s menu lets you Rename, Duplicate, Copy link, Move to folder or Delete it.Sharing a report
1
Click Share report
In the report’s top bar, click Share report.
2
Add a note and an expiry
Optionally write who the link is for, and choose when it expires: in 7, 30 or 90 days, on a date you pick, or never.
3
Create the link
Click Create link. The link is copied, and it’s shown only once, so paste it somewhere safe.
Related
Creative inspector
Click any creative in a report to see everything about it.
Tags and settings
The AI tags, custom tags and naming rules your reports group by.